| Red | Green | Blue | |
| z | 17.64 | ||
| znorm | Inf | ||
| sky | -Inf | -Inf | -Inf |
| S/N | 27.8 | 43.9 | 47.7 |
| S/N(c) | 0.0 | 0.0 | 0.0 |
| SN(E/C) |
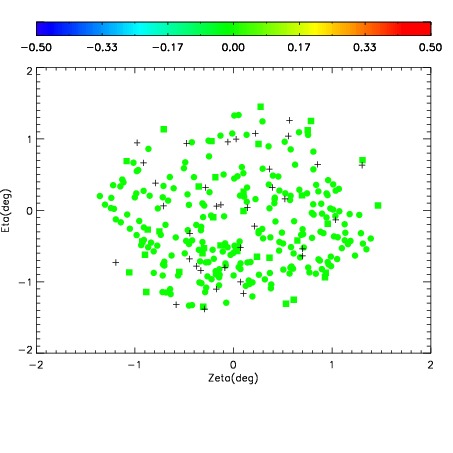
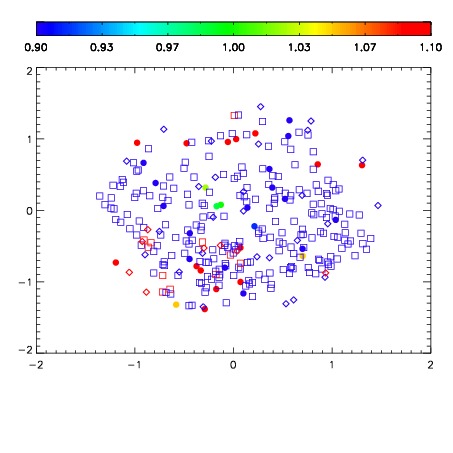


| Frame | Nreads | Zeropoints | Mag plots | Spatial mag deviation | Spatial sky 16325A emission deviations (filled: sky, open: star) | Spatial sky continuum emission | Spatial sky telluric CO2 absorption deviations (filled: H < 10) | |||||||||||||||||||||||
| 0 | 0 |
|
|
|
|
|
|
| IPAIR | NAME | SHIFT | NEWSHIFT | S/N | NAME | SHIFT | NEWSHIFT | S/N |
| 0 | 09080079 | 0.462471 | 0.00000 | 18.9924 | 09080073 | 0.00555565 | 0.456915 | 19.0492 |
| 1 | 09080075 | 0.454656 | 0.00781500 | 19.0938 | 09080070 | 0.00000 | 0.462471 | 19.1127 |
| 2 | 09080076 | 0.457372 | 0.00509900 | 19.0722 | 09080074 | 0.00523146 | 0.457240 | 19.0967 |
| 3 | 09080071 | 0.454988 | 0.00748301 | 19.0548 | 09080077 | 0.00375924 | 0.458712 | 19.0821 |
| 4 | 09080072 | 0.455967 | 0.00650400 | 19.0271 | 09080078 | 0.00380829 | 0.458663 | 19.0648 |