| Red | Green | Blue | |
| z | 17.64 | ||
| znorm | Inf | ||
| sky | -Inf | -Inf | -Inf |
| S/N | 27.0 | 40.9 | 44.9 |
| S/N(c) | 0.0 | 0.0 | 0.0 |
| SN(E/C) |
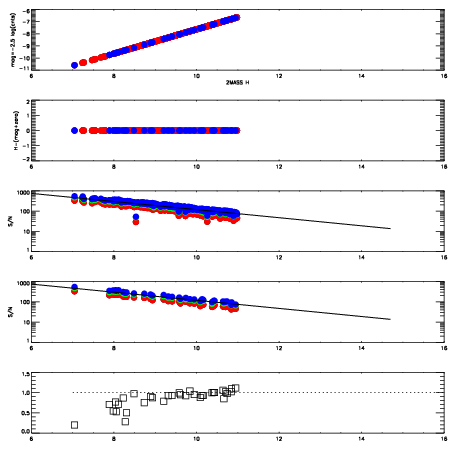
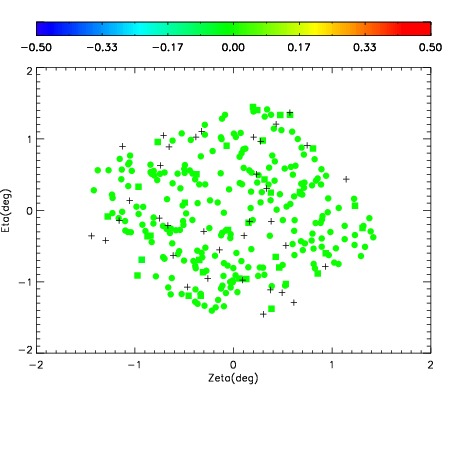
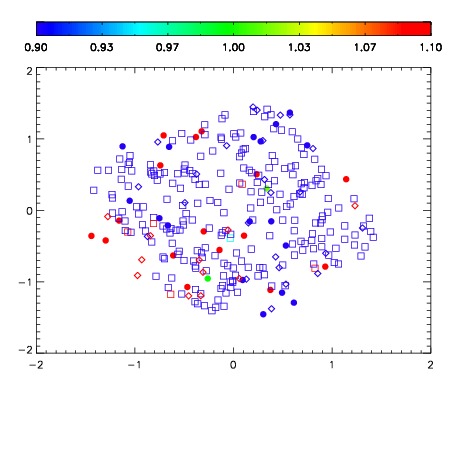
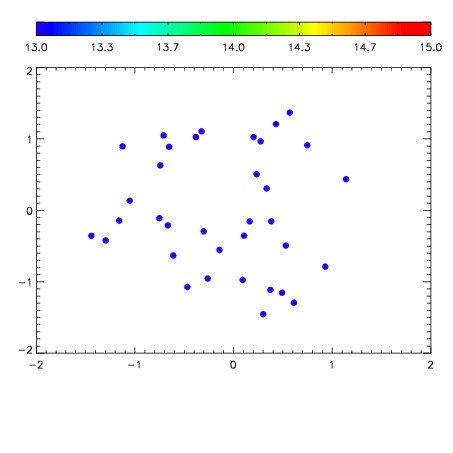

| Frame | Nreads | Zeropoints | Mag plots | Spatial mag deviation | Spatial sky 16325A emission deviations (filled: sky, open: star) | Spatial sky continuum emission | Spatial sky telluric CO2 absorption deviations (filled: H < 10) | |||||||||||||||||||||||
| 0 | 0 |
|
|
|
|
|
|
| IPAIR | NAME | SHIFT | NEWSHIFT | S/N | NAME | SHIFT | NEWSHIFT | S/N |
| 0 | 09010020 | 0.465153 | 0.00000 | 18.6547 | 09010023 | 0.00376213 | 0.461391 | 18.8503 |
| 1 | 09010021 | 0.463014 | 0.00213900 | 18.8036 | 09010022 | 0.00380325 | 0.461350 | 18.9157 |
| 2 | 09010024 | 0.464290 | 0.000863016 | 18.6462 | 09010026 | 0.00585838 | 0.459295 | 18.7747 |
| 3 | 09010025 | 0.464254 | 0.000899017 | 18.6122 | 09010019 | 0.00000 | 0.465153 | 18.6974 |