| Red | Green | Blue | |
| z | 17.64 | ||
| znorm | Inf | ||
| sky | -Inf | -Inf | -Inf |
| S/N | 33.3 | 49.3 | 53.9 |
| S/N(c) | 0.0 | 0.0 | 0.0 |
| SN(E/C) |
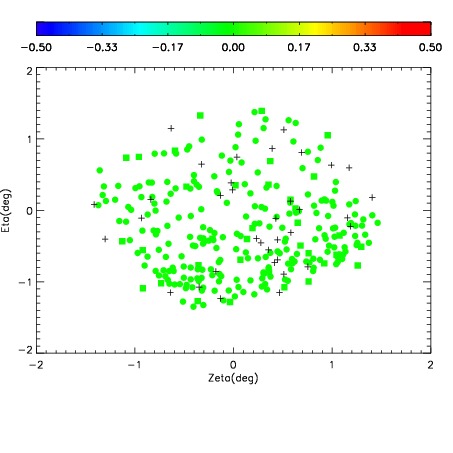
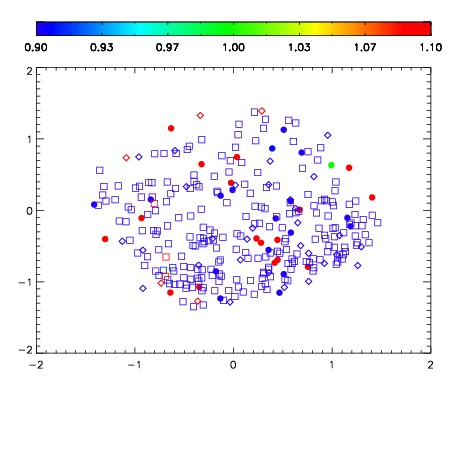
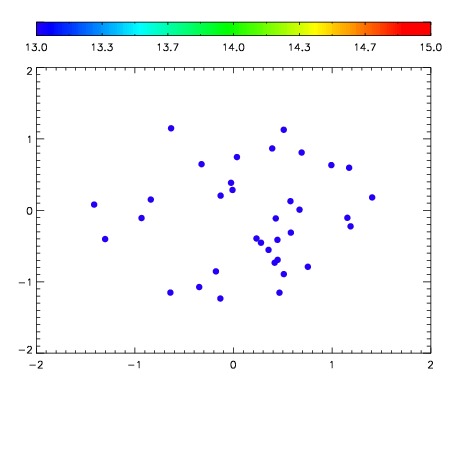

| Frame | Nreads | Zeropoints | Mag plots | Spatial mag deviation | Spatial sky 16325A emission deviations (filled: sky, open: star) | Spatial sky continuum emission | Spatial sky telluric CO2 absorption deviations (filled: H < 10) | |||||||||||||||||||||||
| 0 | 0 |
|
|
|
|
|
|
| IPAIR | NAME | SHIFT | NEWSHIFT | S/N | NAME | SHIFT | NEWSHIFT | S/N |
| 0 | 09020021 | 0.469061 | 0.00000 | 18.8909 | 09020019 | 0.00160964 | 0.467451 | 18.9404 |
| 1 | 09020018 | 0.463300 | 0.00576100 | 18.8600 | 09020020 | 0.00169607 | 0.467365 | 18.8340 |
| 2 | 09020017 | 0.463098 | 0.00596300 | 18.8211 | 09020016 | 0.00316847 | 0.465893 | 18.7741 |
| 3 | 09020014 | 0.464010 | 0.00505099 | 18.7409 | 09020015 | 0.00357515 | 0.465486 | 18.7739 |
| 4 | 09020013 | 0.465189 | 0.00387198 | 18.7180 | 09020012 | 0.00000 | 0.469061 | 18.6576 |