| Red | Green | Blue | |
| z | 17.64 | ||
| znorm | Inf | ||
| sky | -NaN | -NaN | -Inf |
| S/N | 27.0 | 46.0 | 49.1 |
| S/N(c) | 0.0 | 0.0 | 0.0 |
| SN(E/C) |
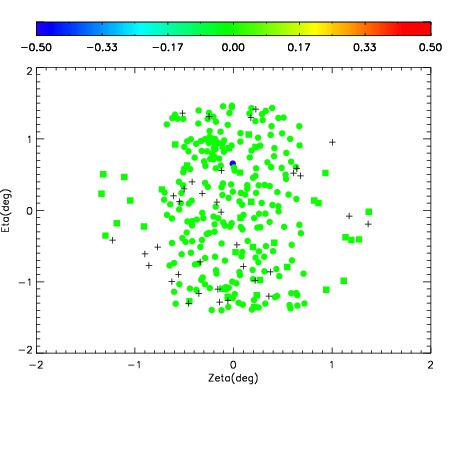
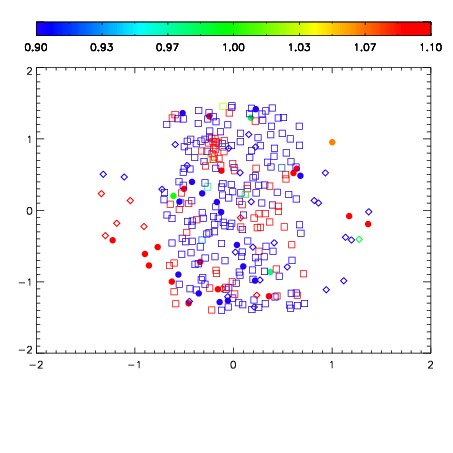
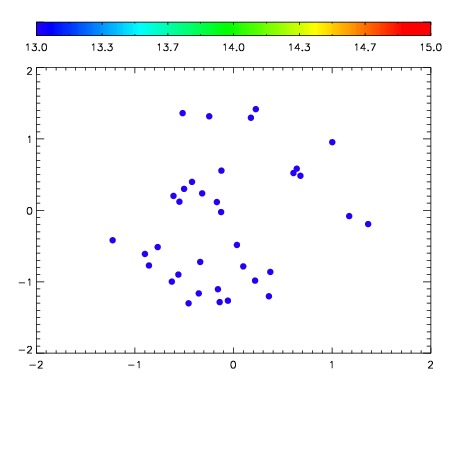

| Frame | Nreads | Zeropoints | Mag plots | Spatial mag deviation | Spatial sky 16325A emission deviations (filled: sky, open: star) | Spatial sky continuum emission | Spatial sky telluric CO2 absorption deviations (filled: H < 10) | |||||||||||||||||||||||
| 0 | 0 |
|
|
|
|
|
|
| IPAIR | NAME | SHIFT | NEWSHIFT | S/N | NAME | SHIFT | NEWSHIFT | S/N |
| 0 | 10490040 | 0.499630 | 0.00000 | 18.9929 | 10490039 | 0.00000 | 0.499630 | 18.9446 |
| 1 | 10490041 | 0.498675 | 0.000955015 | 19.0488 | 10490042 | 0.000432004 | 0.499198 | 19.0428 |
| 2 | 10490044 | 0.498746 | 0.000883996 | 18.9137 | 10490043 | 0.000719476 | 0.498911 | 18.9041 |
| 3 | 10490045 | 0.499141 | 0.000488997 | 18.9107 | 10490046 | 0.00323101 | 0.496399 | 18.8930 |