| Red | Green | Blue | |
| z | 17.64 | ||
| znorm | Inf | ||
| sky | -Inf | -Inf | -Inf |
| S/N | 29.6 | 48.6 | 51.4 |
| S/N(c) | 0.0 | 0.0 | 0.0 |
| SN(E/C) |

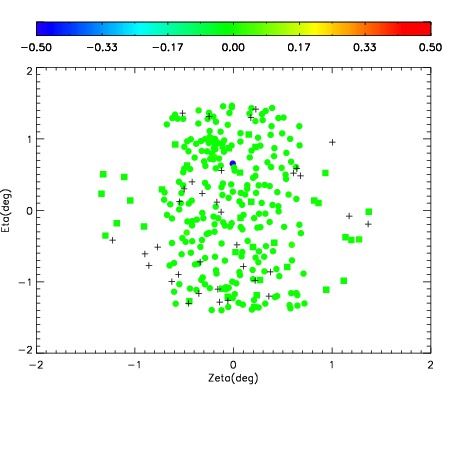
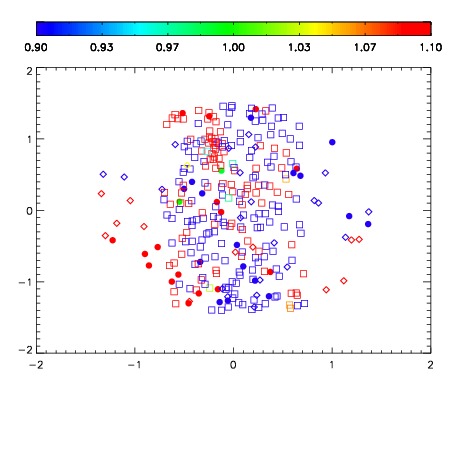


| Frame | Nreads | Zeropoints | Mag plots | Spatial mag deviation | Spatial sky 16325A emission deviations (filled: sky, open: star) | Spatial sky continuum emission | Spatial sky telluric CO2 absorption deviations (filled: H < 10) | |||||||||||||||||||||||
| 0 | 0 |
|
|
|
|
|
|
| IPAIR | NAME | SHIFT | NEWSHIFT | S/N | NAME | SHIFT | NEWSHIFT | S/N |
| 0 | 10750024 | 0.493831 | 0.00000 | 19.1662 | 10750026 | -0.000535373 | 0.494366 | 19.0777 |
| 1 | 10750023 | 0.493566 | 0.000265002 | 19.1736 | 10750025 | -0.000927208 | 0.494758 | 19.1521 |
| 2 | 10750027 | 0.492792 | 0.00103900 | 19.1158 | 10750022 | 0.00000 | 0.493831 | 19.0477 |
| 3 | 10750028 | 0.493111 | 0.000719994 | 19.1079 | 10750029 | 0.000651925 | 0.493179 | 19.0145 |