| Red | Green | Blue | |
| z | 17.64 | ||
| znorm | Inf | ||
| sky | -Inf | -NaN | -NaN |
| S/N | 19.4 | 32.8 | 35.8 |
| S/N(c) | 0.0 | 0.0 | 0.0 |
| SN(E/C) |

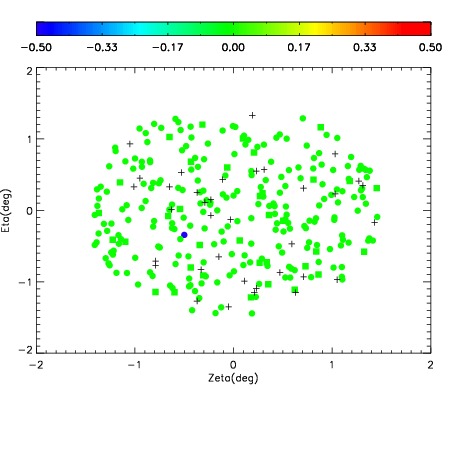
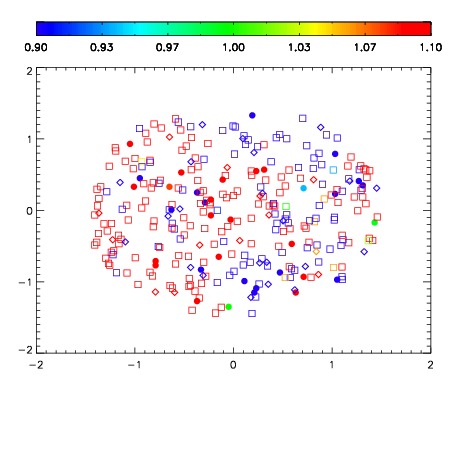


| Frame | Nreads | Zeropoints | Mag plots | Spatial mag deviation | Spatial sky 16325A emission deviations (filled: sky, open: star) | Spatial sky continuum emission | Spatial sky telluric CO2 absorption deviations (filled: H < 10) | |||||||||||||||||||||||
| 0 | 0 |
|
|
|
|
|
|
| IPAIR | NAME | SHIFT | NEWSHIFT | S/N | NAME | SHIFT | NEWSHIFT | S/N |
| 0 | 10730027 | 0.546246 | 0.00000 | 18.7280 | 10730026 | 0.0262595 | 0.519987 | 18.6864 |
| 1 | 10730028 | 0.546235 | 1.09673e-05 | 18.7813 | 10730029 | 0.0275775 | 0.518668 | 18.7520 |
| 2 | 10730024 | 0.515128 | 0.0311180 | 18.4155 | 10730025 | 0.0255330 | 0.520713 | 18.5902 |
| 3 | 10730023 | 0.515900 | 0.0303460 | 18.1783 | 10730022 | 0.00000 | 0.546246 | 18.5525 |