| Red | Green | Blue | |
| z | 17.64 | ||
| znorm | Inf | ||
| sky | -NaN | -NaN | -Inf |
| S/N | 25.2 | 40.4 | 44.6 |
| S/N(c) | 0.0 | 0.0 | 0.0 |
| SN(E/C) |
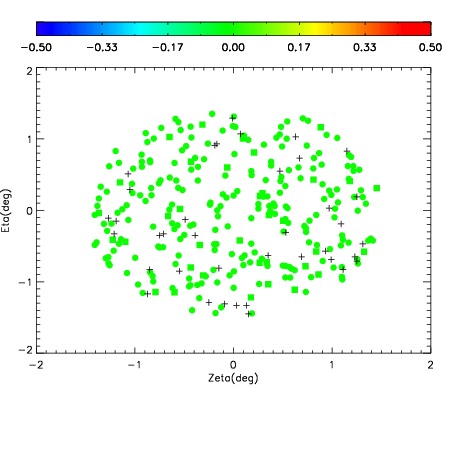
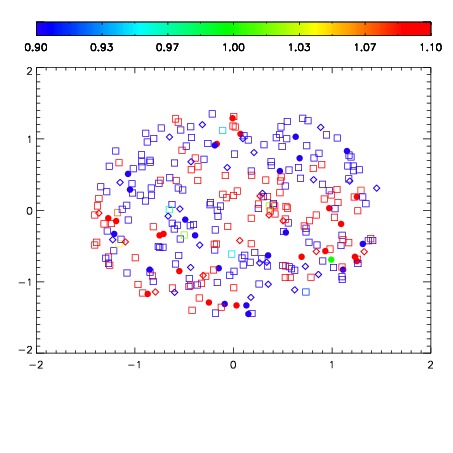
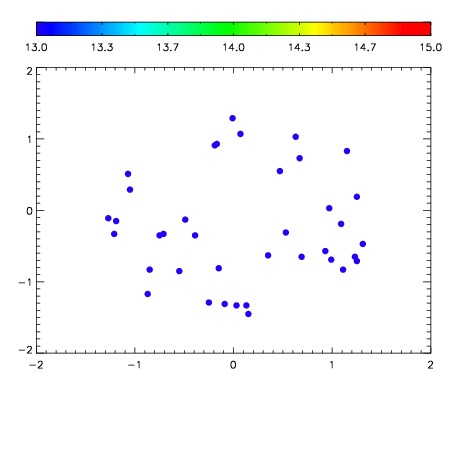

| Frame | Nreads | Zeropoints | Mag plots | Spatial mag deviation | Spatial sky 16325A emission deviations (filled: sky, open: star) | Spatial sky continuum emission | Spatial sky telluric CO2 absorption deviations (filled: H < 10) | |||||||||||||||||||||||
| 0 | 0 |
|
|
|
|
|
|
| IPAIR | NAME | SHIFT | NEWSHIFT | S/N | NAME | SHIFT | NEWSHIFT | S/N |
| 0 | 11040014 | 0.484984 | 0.00000 | 19.0453 | 11040019 | -0.000296666 | 0.485281 | 19.0637 |
| 1 | 11040013 | 0.484871 | 0.000113010 | 19.0032 | 11040015 | 6.63081e-05 | 0.484918 | 19.0487 |
| 2 | 11040018 | 0.482669 | 0.00231501 | 18.9725 | 11040012 | 0.00000 | 0.484984 | 18.9877 |
| 3 | 11040017 | 0.482711 | 0.00227302 | 18.7979 | 11040016 | -0.000153933 | 0.485138 | 18.8815 |