| Red | Green | Blue | |
| z | 17.64 | ||
| znorm | Inf | ||
| sky | -Inf | -Inf | -Inf |
| S/N | 28.4 | 48.2 | 51.7 |
| S/N(c) | 0.0 | 0.0 | 0.0 |
| SN(E/C) |

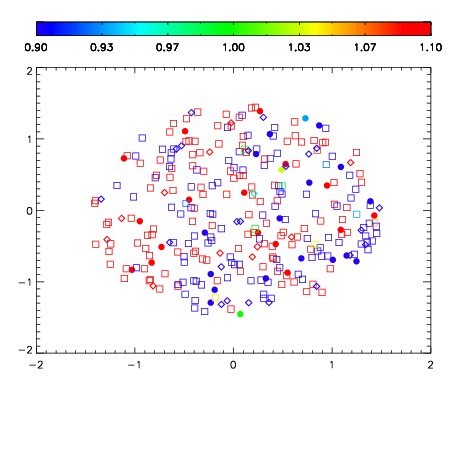


| Frame | Nreads | Zeropoints | Mag plots | Spatial mag deviation | Spatial sky 16325A emission deviations (filled: sky, open: star) | Spatial sky continuum emission | Spatial sky telluric CO2 absorption deviations (filled: H < 10) | |||||||||||||||||||||||
| 0 | 0 |
|
|
|
|
|
|
| IPAIR | NAME | SHIFT | NEWSHIFT | S/N | NAME | SHIFT | NEWSHIFT | S/N |
| 0 | 10840028 | 0.491750 | 0.00000 | 18.9151 | 10840030 | -0.000313237 | 0.492063 | 18.9753 |
| 1 | 10840031 | 0.490161 | 0.00158900 | 18.9900 | 10840033 | 0.000299759 | 0.491450 | 19.0091 |
| 2 | 10840032 | 0.490207 | 0.00154302 | 18.9595 | 10840034 | 0.000269060 | 0.491481 | 19.0000 |
| 3 | 10840027 | 0.491672 | 7.79927e-05 | 18.8968 | 10840029 | -0.000264872 | 0.492015 | 18.9237 |
| 4 | 10840035 | 0.490585 | 0.00116500 | 18.8660 | 10840026 | 0.00000 | 0.491750 | 18.7947 |