| Red | Green | Blue | |
| z | 17.64 | ||
| znorm | Inf | ||
| sky | -Inf | -Inf | -Inf |
| S/N | 19.9 | 34.7 | 38.4 |
| S/N(c) | 0.0 | 0.0 | 0.0 |
| SN(E/C) |
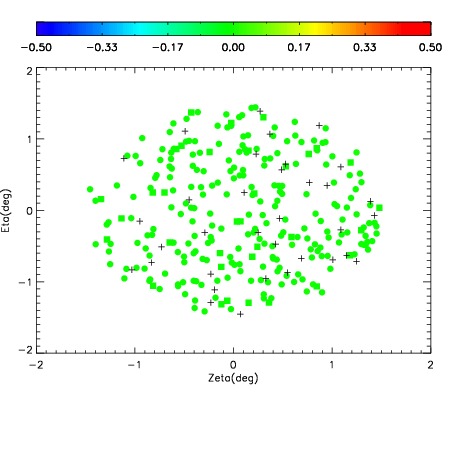
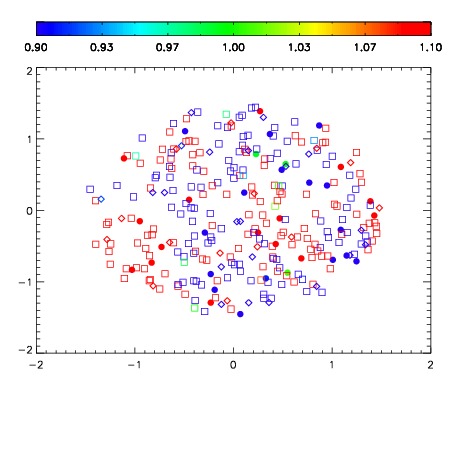
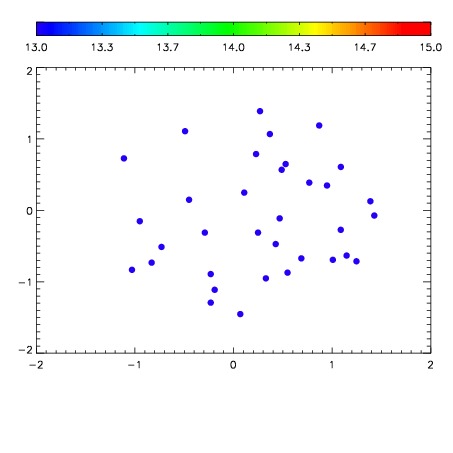

| Frame | Nreads | Zeropoints | Mag plots | Spatial mag deviation | Spatial sky 16325A emission deviations (filled: sky, open: star) | Spatial sky continuum emission | Spatial sky telluric CO2 absorption deviations (filled: H < 10) | |||||||||||||||||||||||
| 0 | 0 |
|
|
|
|
|
|
| IPAIR | NAME | SHIFT | NEWSHIFT | S/N | NAME | SHIFT | NEWSHIFT | S/N |
| 0 | 11060012 | 0.481207 | 0.00000 | 18.5477 | 11060018 | -0.00164949 | 0.482857 | 18.6970 |
| 1 | 11060017 | 0.479184 | 0.00202301 | 18.8891 | 11060015 | -0.00283627 | 0.484043 | 18.7202 |
| 2 | 11060016 | 0.478966 | 0.00224102 | 18.6797 | 11060014 | -0.00192570 | 0.483133 | 18.7183 |
| 3 | 11060013 | 0.481139 | 6.80089e-05 | 18.4527 | 11060011 | 0.00000 | 0.481207 | 18.4551 |