| Red | Green | Blue | |
| z | 17.64 | ||
| znorm | Inf | ||
| sky | -Inf | -NaN | -NaN |
| S/N | 19.8 | 33.4 | 36.3 |
| S/N(c) | 0.0 | 0.0 | 0.0 |
| SN(E/C) |
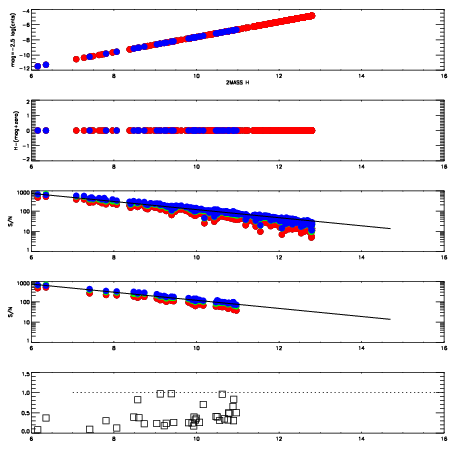
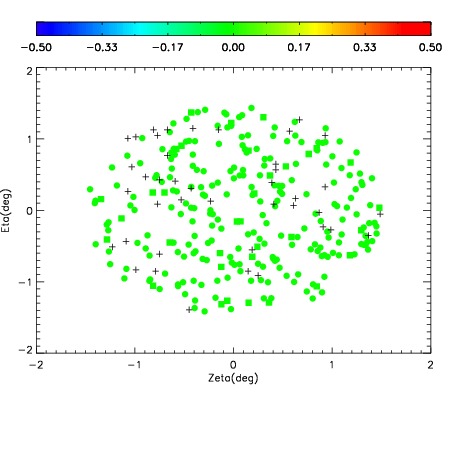


| Frame | Nreads | Zeropoints | Mag plots | Spatial mag deviation | Spatial sky 16325A emission deviations (filled: sky, open: star) | Spatial sky continuum emission | Spatial sky telluric CO2 absorption deviations (filled: H < 10) | |||||||||||||||||||||||
| 0 | 0 |
|
|
|
|
|
|
| IPAIR | NAME | SHIFT | NEWSHIFT | S/N | NAME | SHIFT | NEWSHIFT | S/N |
| 0 | 10810028 | 0.489491 | 0.00000 | 18.6287 | 10810026 | 0.000953260 | 0.488538 | 18.5486 |
| 1 | 10810023 | 0.488661 | 0.000829995 | 18.8582 | 10810025 | 0.000749093 | 0.488742 | 18.8081 |
| 2 | 10810024 | 0.489332 | 0.000158995 | 18.8170 | 10810022 | 0.00000 | 0.489491 | 18.7831 |
| 3 | 10810027 | 0.489132 | 0.000358999 | 18.7788 | 10810029 | 1.53968e-05 | 0.489476 | 18.6488 |