| Red | Green | Blue | |
| z | 17.63 | ||
| znorm | Inf | ||
| sky | -NaN | -NaN | -NaN |
| S/N | 27.1 | 43.9 | 47.2 |
| S/N(c) | 0.0 | 0.0 | 0.0 |
| SN(E/C) |
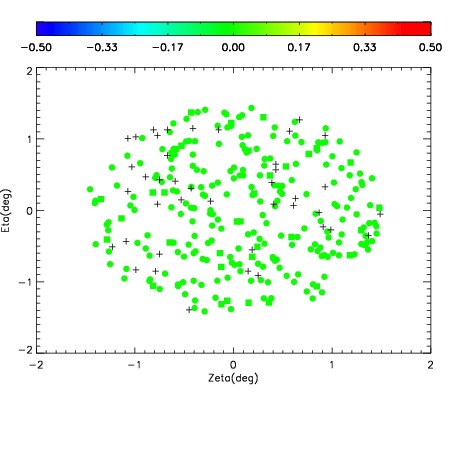
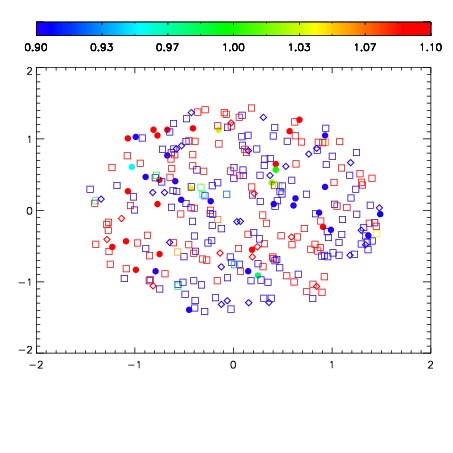
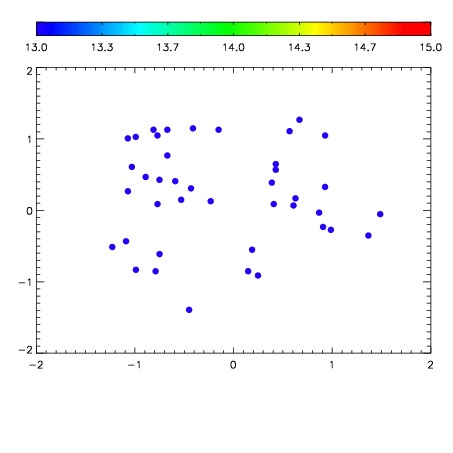

| Frame | Nreads | Zeropoints | Mag plots | Spatial mag deviation | Spatial sky 16325A emission deviations (filled: sky, open: star) | Spatial sky continuum emission | Spatial sky telluric CO2 absorption deviations (filled: H < 10) | |||||||||||||||||||||||
| 0 | 0 |
|
|
|
|
|
|
| IPAIR | NAME | SHIFT | NEWSHIFT | S/N | NAME | SHIFT | NEWSHIFT | S/N |
| 0 | 10880030 | 0.567218 | 0.00000 | 19.0596 | 10880025 | 0.00000 | 0.567218 | 19.1166 |
| 1 | 10880031 | 0.566955 | 0.000263035 | 19.1351 | 10880029 | 0.0634829 | 0.503735 | 19.2063 |
| 2 | 10880026 | 0.490820 | 0.0763980 | 19.1302 | 10880028 | 0.0627929 | 0.504425 | 19.1940 |
| 3 | 10880027 | 0.491992 | 0.0752260 | 19.0431 | 10880032 | 0.0661860 | 0.501032 | 19.0004 |