| Red | Green | Blue | |
| z | 17.64 | ||
| znorm | Inf | ||
| sky | -Inf | -NaN | -Inf |
| S/N | 14.3 | 24.8 | 27.7 |
| S/N(c) | 0.0 | 0.0 | 0.0 |
| SN(E/C) |
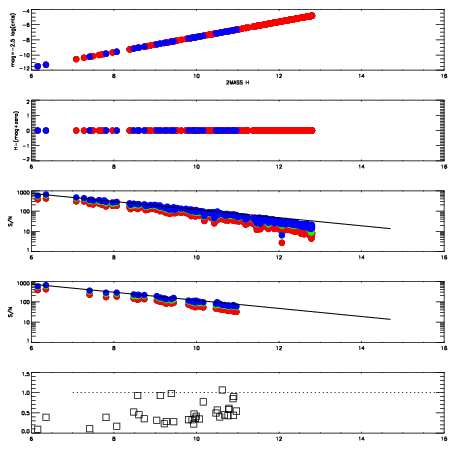
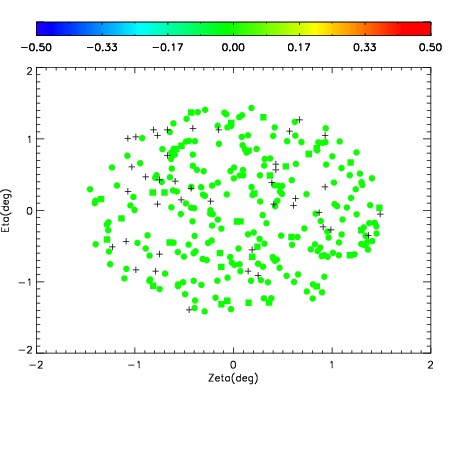
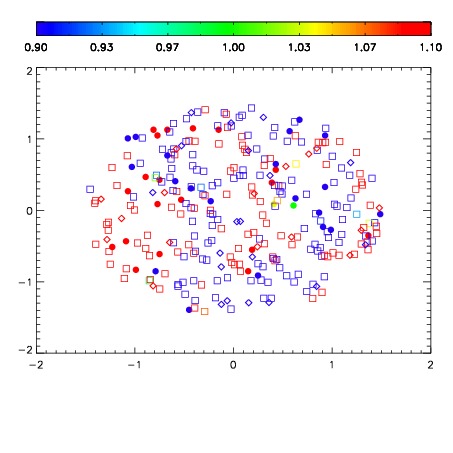
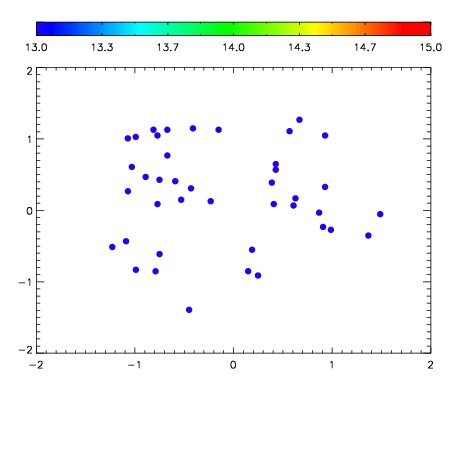

| Frame | Nreads | Zeropoints | Mag plots | Spatial mag deviation | Spatial sky 16325A emission deviations (filled: sky, open: star) | Spatial sky continuum emission | Spatial sky telluric CO2 absorption deviations (filled: H < 10) | |||||||||||||||||||||||
| 0 | 0 |
|
|
|
|
|
|
| IPAIR | NAME | SHIFT | NEWSHIFT | S/N | NAME | SHIFT | NEWSHIFT | S/N |
| 0 | 11080013 | 0.480796 | 0.00000 | 18.2410 | 11080014 | -0.00203321 | 0.482829 | 18.2346 |
| 1 | 11080012 | 0.480218 | 0.000578016 | 18.3186 | 11080011 | 0.00000 | 0.480796 | 18.3789 |
| 2 | 11080016 | 0.477074 | 0.00372201 | 18.2563 | 11080015 | -0.00190850 | 0.482705 | 18.3280 |
| 3 | 11080017 | 0.477981 | 0.00281501 | 18.1190 | 11080018 | -0.00302933 | 0.483825 | 18.1205 |