| Red | Green | Blue | |
| z | 17.64 | ||
| znorm | Inf | ||
| sky | -Inf | -Inf | -Inf |
| S/N | 30.2 | 53.3 | 56.9 |
| S/N(c) | 0.0 | 0.0 | 0.0 |
| SN(E/C) |
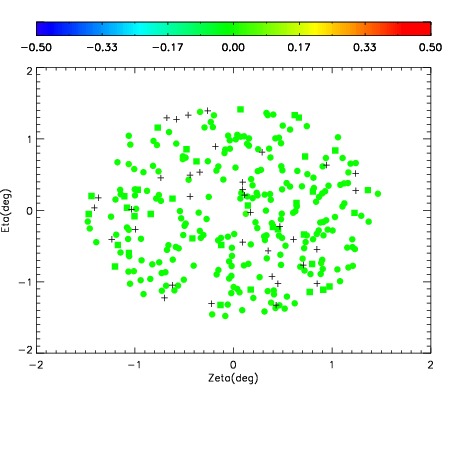
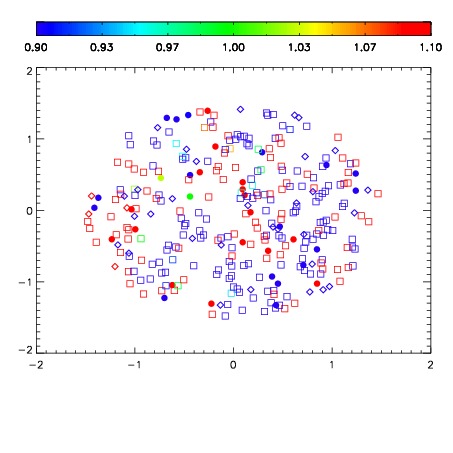
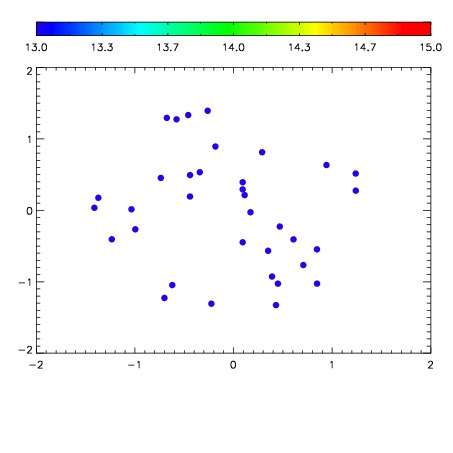

| Frame | Nreads | Zeropoints | Mag plots | Spatial mag deviation | Spatial sky 16325A emission deviations (filled: sky, open: star) | Spatial sky continuum emission | Spatial sky telluric CO2 absorption deviations (filled: H < 10) | |||||||||||||||||||||||
| 0 | 0 |
|
|
|
|
|
|
| IPAIR | NAME | SHIFT | NEWSHIFT | S/N | NAME | SHIFT | NEWSHIFT | S/N |
| 0 | 10250079 | 0.494427 | 0.00000 | 19.0794 | 10250078 | 0.00165440 | 0.492773 | 19.0669 |
| 1 | 10250076 | 0.492350 | 0.00207698 | 19.0287 | 10250074 | 0.000515577 | 0.493911 | 19.0243 |
| 2 | 10250075 | 0.491992 | 0.00243500 | 18.9534 | 10250077 | 0.00205417 | 0.492373 | 18.9959 |
| 3 | 10250072 | 0.493064 | 0.00136301 | 18.9034 | 10250073 | 0.00118667 | 0.493240 | 18.9504 |
| 4 | 10250071 | 0.492368 | 0.00205898 | 18.8955 | 10250070 | 0.00000 | 0.494427 | 18.8885 |