| Red | Green | Blue | |
| z | 17.64 | ||
| znorm | Inf | ||
| sky | -Inf | -NaN | -Inf |
| S/N | 26.4 | 45.7 | 50.4 |
| S/N(c) | 0.0 | 0.0 | 0.0 |
| SN(E/C) |
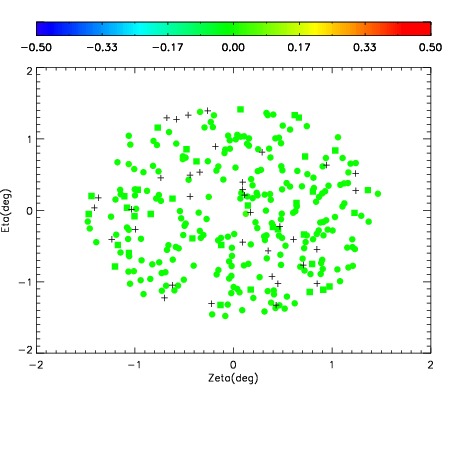
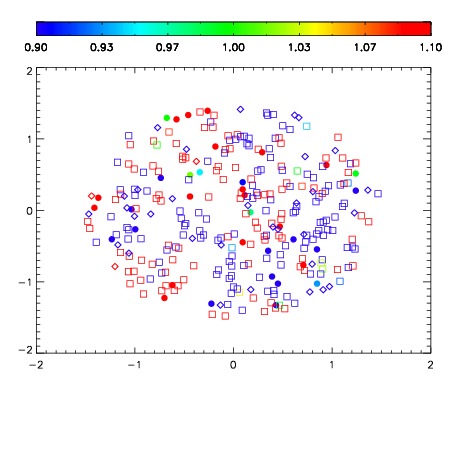
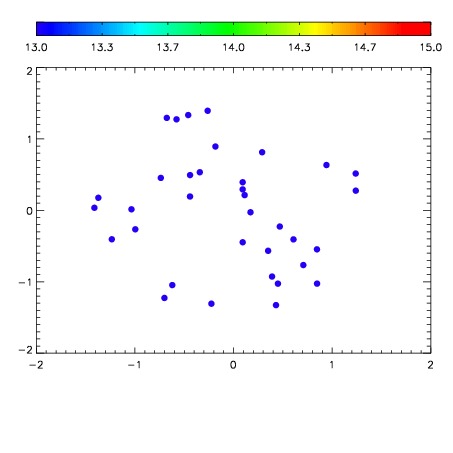

| Frame | Nreads | Zeropoints | Mag plots | Spatial mag deviation | Spatial sky 16325A emission deviations (filled: sky, open: star) | Spatial sky continuum emission | Spatial sky telluric CO2 absorption deviations (filled: H < 10) | |||||||||||||||||||||||
| 0 | 0 |
|
|
|
|
|
|
| IPAIR | NAME | SHIFT | NEWSHIFT | S/N | NAME | SHIFT | NEWSHIFT | S/N |
| 0 | 10540061 | 0.500231 | 0.00000 | 19.0283 | 10540063 | 0.00413798 | 0.496093 | 19.0916 |
| 1 | 10540065 | 0.499782 | 0.000449032 | 19.1201 | 10540066 | 0.00369148 | 0.496540 | 19.1311 |
| 2 | 10540064 | 0.498838 | 0.00139302 | 19.0864 | 10540062 | 0.00414486 | 0.496086 | 19.1042 |
| 3 | 10540060 | 0.499913 | 0.000318021 | 18.2039 | 10540059 | 0.00000 | 0.500231 | 18.4956 |