| Red | Green | Blue | |
| z | 17.64 | ||
| znorm | Inf | ||
| sky | -NaN | -Inf | -Inf |
| S/N | 25.6 | 44.0 | 47.3 |
| S/N(c) | 0.0 | 0.0 | 0.0 |
| SN(E/C) |
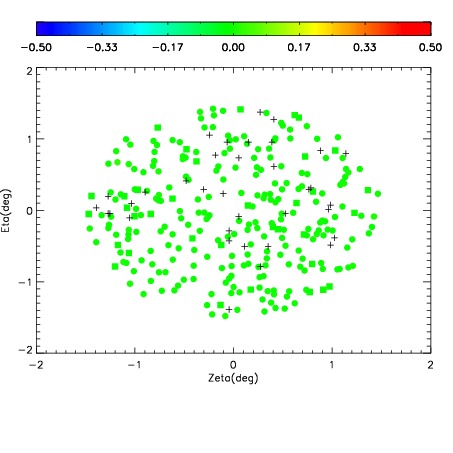
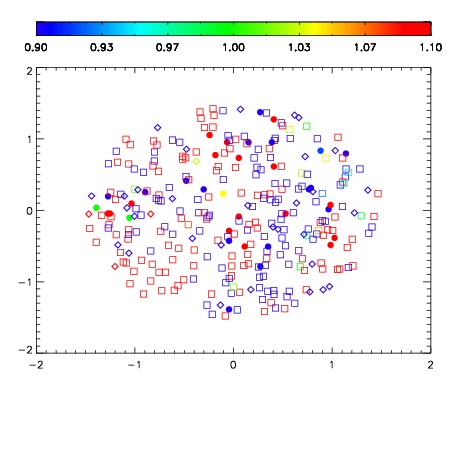
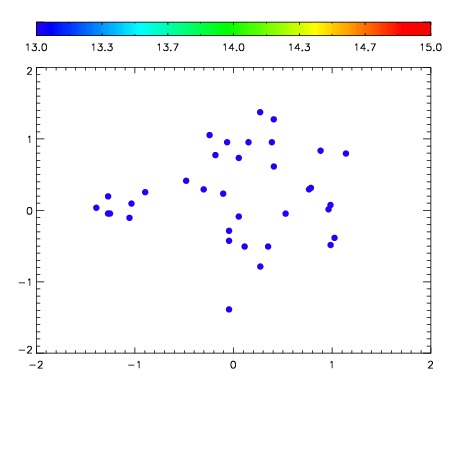

| Frame | Nreads | Zeropoints | Mag plots | Spatial mag deviation | Spatial sky 16325A emission deviations (filled: sky, open: star) | Spatial sky continuum emission | Spatial sky telluric CO2 absorption deviations (filled: H < 10) | |||||||||||||||||||||||
| 0 | 0 |
|
|
|
|
|
|
| IPAIR | NAME | SHIFT | NEWSHIFT | S/N | NAME | SHIFT | NEWSHIFT | S/N |
| 0 | 09980081 | 0.526408 | 0.00000 | 19.1741 | 09980079 | 0.00338778 | 0.523020 | 19.1320 |
| 1 | 09980078 | 0.524876 | 0.00153202 | 19.1392 | 09980080 | 0.00384699 | 0.522561 | 19.0706 |
| 2 | 09980077 | 0.524684 | 0.00172400 | 19.1074 | 09980076 | 0.00000 | 0.526408 | 18.9649 |