| Red | Green | Blue | |
| z | 17.64 | ||
| znorm | Inf | ||
| sky | -Inf | -Inf | -Inf |
| S/N | 29.1 | 50.2 | 52.3 |
| S/N(c) | 0.0 | 0.0 | 0.0 |
| SN(E/C) |
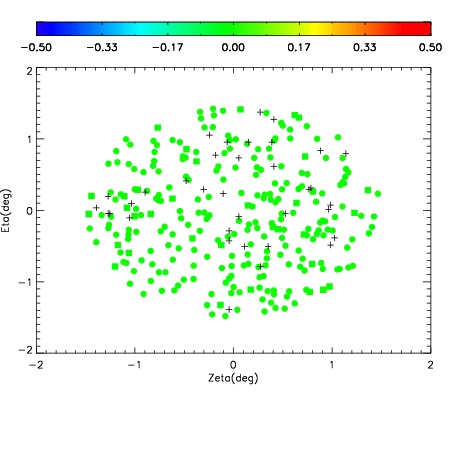
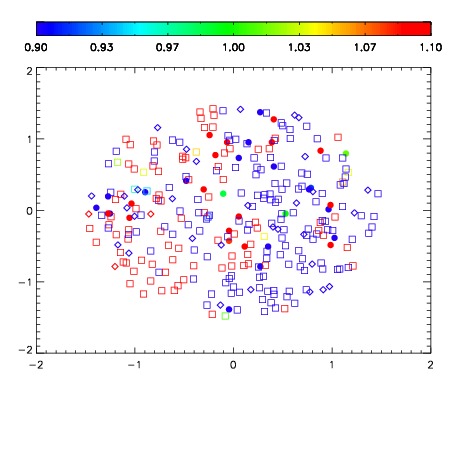
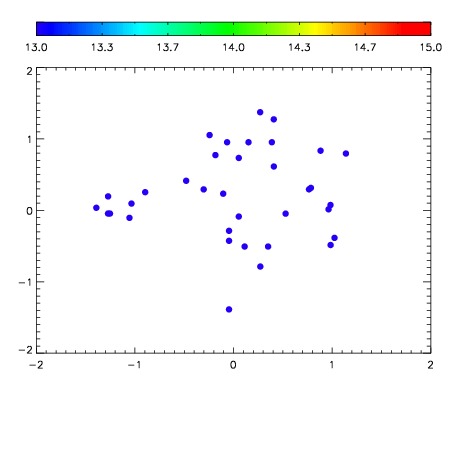

| Frame | Nreads | Zeropoints | Mag plots | Spatial mag deviation | Spatial sky 16325A emission deviations (filled: sky, open: star) | Spatial sky continuum emission | Spatial sky telluric CO2 absorption deviations (filled: H < 10) | |||||||||||||||||||||||
| 0 | 0 |
|
|
|
|
|
|
| IPAIR | NAME | SHIFT | NEWSHIFT | S/N | NAME | SHIFT | NEWSHIFT | S/N |
| 0 | 10260071 | 0.491089 | 0.00000 | 19.1593 | 10260072 | -0.000519718 | 0.491609 | 19.1207 |
| 1 | 10260075 | 0.490692 | 0.000396997 | 19.1946 | 10260073 | -7.58618e-05 | 0.491165 | 19.1706 |
| 2 | 10260074 | 0.489934 | 0.00115499 | 19.1693 | 10260076 | -0.000736594 | 0.491826 | 19.1669 |
| 3 | 10260070 | 0.490577 | 0.000511974 | 19.1282 | 10260069 | 0.00000 | 0.491089 | 19.0904 |