| Red | Green | Blue | |
| z | 17.62 | ||
| znorm | Inf | ||
| sky | -NaN | -NaN | -Inf |
| S/N | 95.5 | 127.6 | 141.2 |
| S/N(c) | 14.3 | 57.3 | 49.7 |
| SN(E/C) |
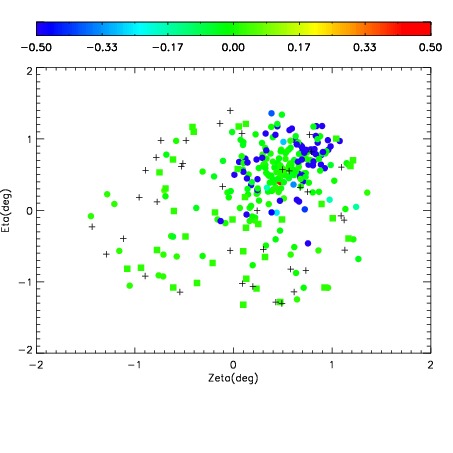
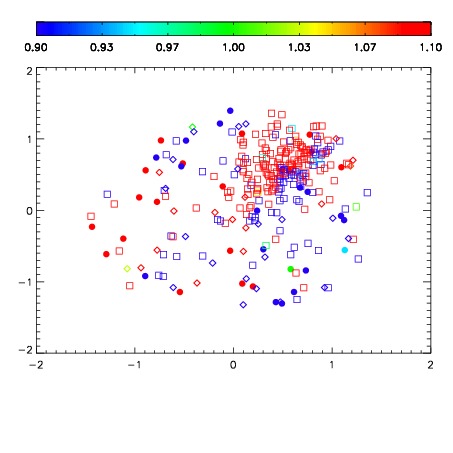
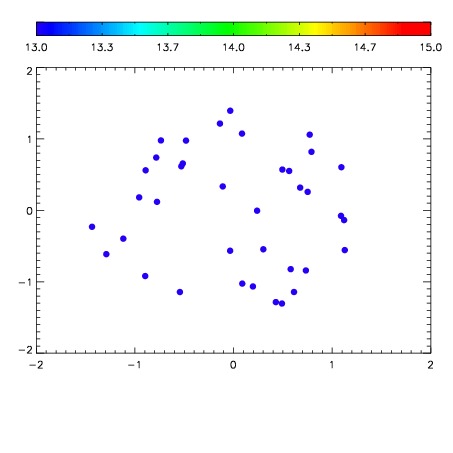

| Frame | Nreads | Zeropoints | Mag plots | Spatial mag deviation | Spatial sky 16325A emission deviations (filled: sky, open: star) | Spatial sky continuum emission | Spatial sky telluric CO2 absorption deviations (filled: H < 10) | |||||||||||||||||||||||
| 0 | 0 |
|
|
|
|
|
|
| IPAIR | NAME | SHIFT | NEWSHIFT | S/N | NAME | SHIFT | NEWSHIFT | S/N |
| 0 | 11100012 | 0.473842 | 0.00000 | 17.9769 | 11100011 | 0.00000 | 0.473842 | 17.8903 |
| 1 | 11100016 | 0.472780 | 0.00106201 | 18.3504 | 11100015 | -0.00332098 | 0.477163 | 18.3216 |
| 2 | 11100017 | 0.472821 | 0.00102100 | 18.2446 | 11100014 | -0.00324921 | 0.477091 | 18.3155 |
| 3 | 11100013 | 0.472842 | 0.000999987 | 18.0978 | 11100018 | -0.00232671 | 0.476169 | 18.3023 |