| Red | Green | Blue | |
| z | 17.63 | ||
| znorm | Inf | ||
| sky | -NaN | -NaN | -Inf |
| S/N | 23.7 | 43.4 | 46.3 |
| S/N(c) | 34.6 | 39.1 | 53.2 |
| SN(E/C) |
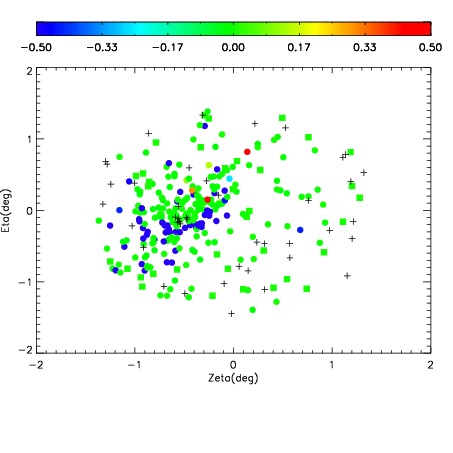

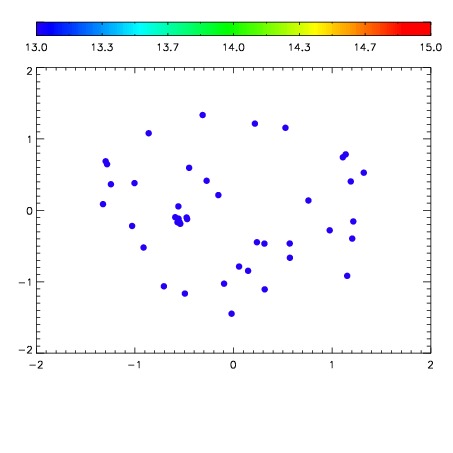

| Frame | Nreads | Zeropoints | Mag plots | Spatial mag deviation | Spatial sky 16325A emission deviations (filled: sky, open: star) | Spatial sky continuum emission | Spatial sky telluric CO2 absorption deviations (filled: H < 10) | |||||||||||||||||||||||
| 0 | 0 |
|
|
|
|
|
|
| IPAIR | NAME | SHIFT | NEWSHIFT | S/N | NAME | SHIFT | NEWSHIFT | S/N |
| 0 | 10490067 | 0.502673 | 0.00000 | 18.5299 | 10490064 | 0.00181765 | 0.500855 | 18.4513 |
| 1 | 10490063 | 0.501500 | 0.00117296 | 18.5022 | 10490061 | 0.00000 | 0.502673 | 18.4159 |
| 2 | 10490062 | 0.500832 | 0.00184095 | 18.4588 | 10490065 | 0.00188439 | 0.500789 | 18.4123 |
| 3 | 10490066 | 0.502542 | 0.000130951 | 18.4309 | 10490068 | 0.00533153 | 0.497341 | 18.4068 |