| Red | Green | Blue | |
| z | 17.63 | ||
| znorm | Inf | ||
| sky | -Inf | -NaN | -Inf |
| S/N | 23.4 | 42.9 | 46.6 |
| S/N(c) | 37.1 | 43.8 | 30.0 |
| SN(E/C) |
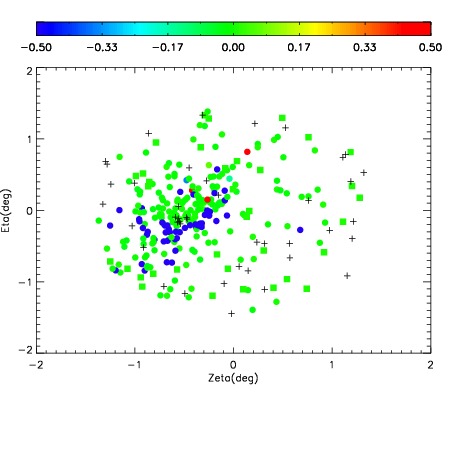
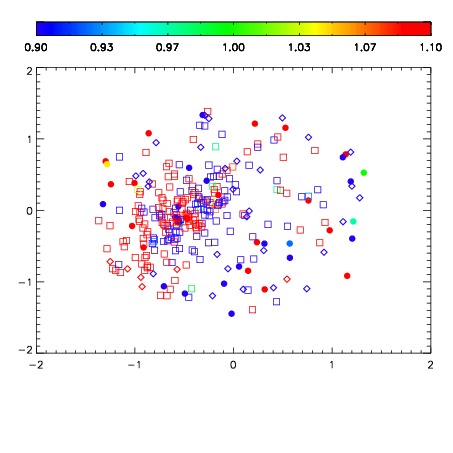
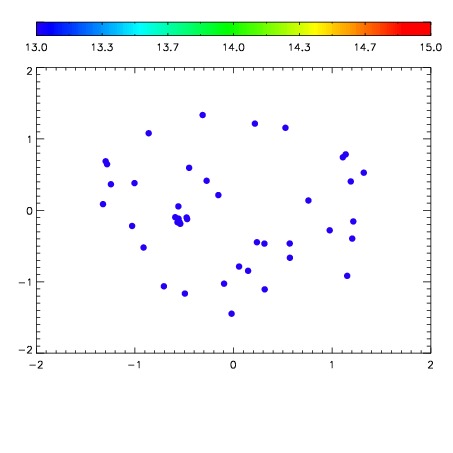

| Frame | Nreads | Zeropoints | Mag plots | Spatial mag deviation | Spatial sky 16325A emission deviations (filled: sky, open: star) | Spatial sky continuum emission | Spatial sky telluric CO2 absorption deviations (filled: H < 10) | |||||||||||||||||||||||
| 0 | 0 |
|
|
|
|
|
|
| IPAIR | NAME | SHIFT | NEWSHIFT | S/N | NAME | SHIFT | NEWSHIFT | S/N |
| 0 | 10840041 | 0.491765 | 0.00000 | 18.4781 | 10840039 | 0.00000 | 0.491765 | 18.5106 |
| 1 | 10840044 | 0.487386 | 0.00437900 | 18.4708 | 10840043 | -0.00142051 | 0.493185 | 18.4973 |
| 2 | 10840045 | 0.487820 | 0.00394499 | 18.4547 | 10840046 | -0.00150554 | 0.493271 | 18.4800 |
| 3 | 10840040 | 0.491569 | 0.000195980 | 18.4411 | 10840042 | -0.00119152 | 0.492957 | 18.4616 |