| Red | Green | Blue | |
| z | 17.64 | ||
| znorm | Inf | ||
| sky | -NaN | -NaN | -Inf |
| S/N | 22.7 | 38.8 | 39.9 |
| S/N(c) | 0.0 | 0.0 | 0.0 |
| SN(E/C) |
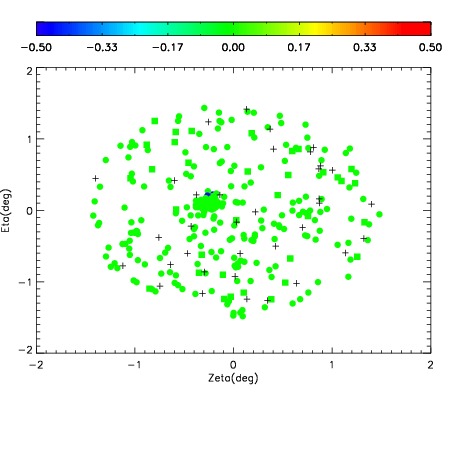
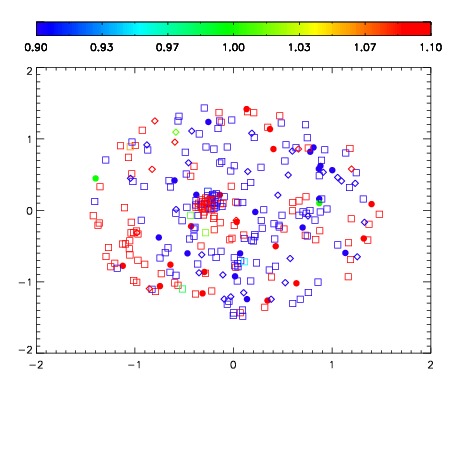
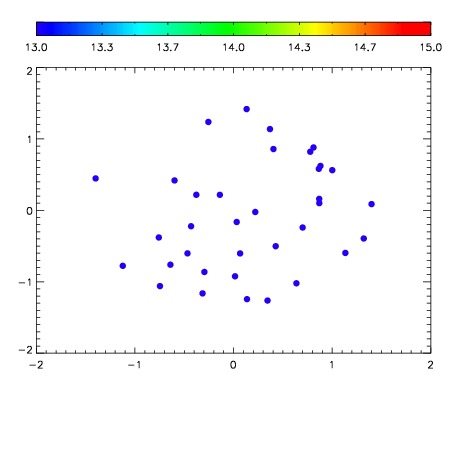

| Frame | Nreads | Zeropoints | Mag plots | Spatial mag deviation | Spatial sky 16325A emission deviations (filled: sky, open: star) | Spatial sky continuum emission | Spatial sky telluric CO2 absorption deviations (filled: H < 10) | |||||||||||||||||||||||
| 0 | 0 |
|
|
|
|
|
|
| IPAIR | NAME | SHIFT | NEWSHIFT | S/N | NAME | SHIFT | NEWSHIFT | S/N |
| 0 | 11120013 | 0.477657 | 0.00000 | 18.8058 | 11120014 | -0.00432798 | 0.481985 | 18.8180 |
| 1 | 11120016 | 0.476167 | 0.00149000 | 18.8911 | 11120018 | -0.00357342 | 0.481230 | 18.9085 |
| 2 | 11120012 | 0.476822 | 0.000835001 | 18.8865 | 11120015 | -0.00467069 | 0.482328 | 18.8702 |
| 3 | 11120017 | 0.476841 | 0.000815988 | 18.8623 | 11120011 | 0.00000 | 0.477657 | 18.8540 |