| Red | Green | Blue | |
| z | 17.64 | ||
| znorm | Inf | ||
| sky | -Inf | -Inf | -NaN |
| S/N | 31.6 | 48.6 | 47.3 |
| S/N(c) | 0.0 | 0.0 | 0.0 |
| SN(E/C) |
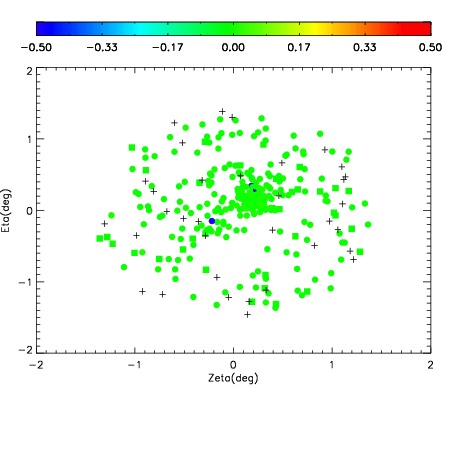
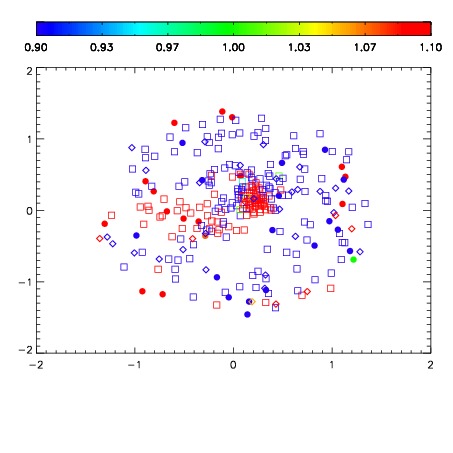


| Frame | Nreads | Zeropoints | Mag plots | Spatial mag deviation | Spatial sky 16325A emission deviations (filled: sky, open: star) | Spatial sky continuum emission | Spatial sky telluric CO2 absorption deviations (filled: H < 10) | |||||||||||||||||||||||
| 0 | 0 |
|
|
|
|
|
|
| IPAIR | NAME | SHIFT | NEWSHIFT | S/N | NAME | SHIFT | NEWSHIFT | S/N |
| 0 | 11070024 | 0.478431 | 0.00000 | 19.2138 | 11070022 | 0.00000 | 0.478431 | 19.1850 |
| 1 | 11070023 | 0.477513 | 0.000918001 | 19.2151 | 11070029 | 6.55989e-05 | 0.478365 | 19.2285 |
| 2 | 11070028 | 0.478154 | 0.000276983 | 19.1668 | 11070026 | 0.00159280 | 0.476838 | 19.1775 |
| 3 | 11070027 | 0.478049 | 0.000381976 | 19.1394 | 11070025 | 0.00141063 | 0.477020 | 19.1350 |