| Red | Green | Blue | |
| z | 17.64 | ||
| znorm | Inf | ||
| sky | -Inf | -Inf | -Inf |
| S/N | 23.6 | 37.8 | 37.1 |
| S/N(c) | 0.0 | 0.0 | 0.0 |
| SN(E/C) |
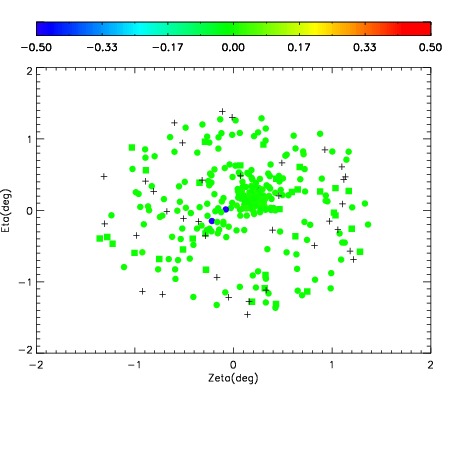
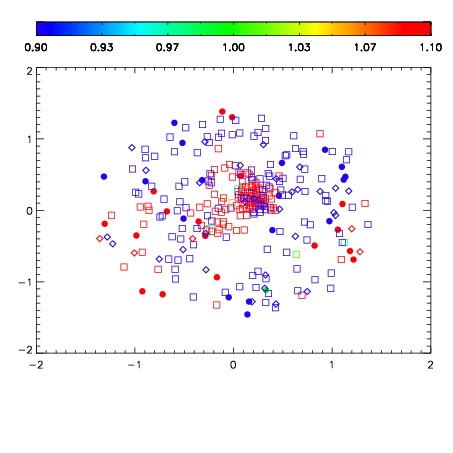


| Frame | Nreads | Zeropoints | Mag plots | Spatial mag deviation | Spatial sky 16325A emission deviations (filled: sky, open: star) | Spatial sky continuum emission | Spatial sky telluric CO2 absorption deviations (filled: H < 10) | |||||||||||||||||||||||
| 0 | 0 |
|
|
|
|
|
|
| IPAIR | NAME | SHIFT | NEWSHIFT | S/N | NAME | SHIFT | NEWSHIFT | S/N |
| 0 | 11110016 | 0.474049 | 0.00000 | 18.6607 | 11110015 | -0.00425560 | 0.478305 | 18.6381 |
| 1 | 11110012 | 0.473666 | 0.000382990 | 18.8769 | 11110011 | 0.00000 | 0.474049 | 18.9364 |
| 2 | 11110013 | 0.474018 | 3.09944e-05 | 18.8346 | 11110018 | -0.00140207 | 0.475451 | 18.7945 |
| 3 | 11110017 | 0.473772 | 0.000277013 | 18.7272 | 11110014 | -0.00442021 | 0.478469 | 18.7235 |