| Red | Green | Blue | |
| z | 17.64 | ||
| znorm | Inf | ||
| sky | -Inf | -Inf | -Inf |
| S/N | 28.9 | 45.5 | 44.2 |
| S/N(c) | 0.0 | 0.0 | 0.0 |
| SN(E/C) |
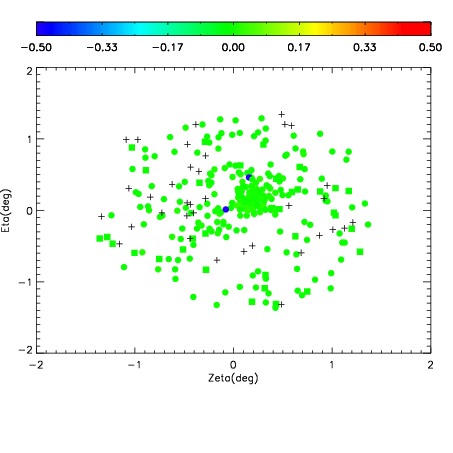
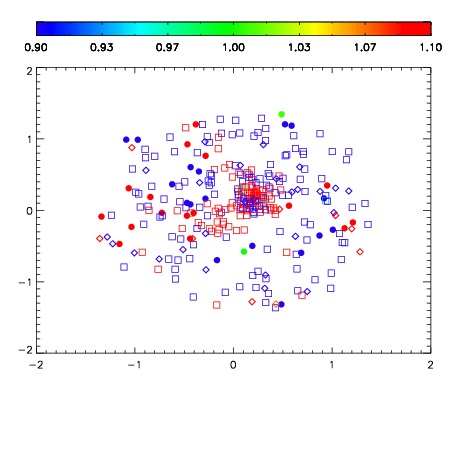
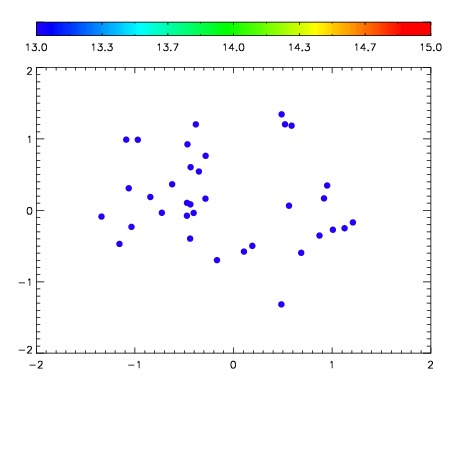

| Frame | Nreads | Zeropoints | Mag plots | Spatial mag deviation | Spatial sky 16325A emission deviations (filled: sky, open: star) | Spatial sky continuum emission | Spatial sky telluric CO2 absorption deviations (filled: H < 10) | |||||||||||||||||||||||
| 0 | 0 |
|
|
|
|
|
|
| IPAIR | NAME | SHIFT | NEWSHIFT | S/N | NAME | SHIFT | NEWSHIFT | S/N |
| 0 | 11130013 | 0.473160 | 0.00000 | 19.0156 | 11130015 | -0.0107960 | 0.483956 | 19.0185 |
| 1 | 11130016 | 0.470712 | 0.00244799 | 19.0878 | 11130014 | -0.0111014 | 0.484261 | 19.0819 |
| 2 | 11130017 | 0.471284 | 0.00187600 | 19.0559 | 11130018 | -0.0106385 | 0.483799 | 19.0551 |
| 3 | 11130012 | 0.472564 | 0.000595987 | 18.9798 | 11130011 | 0.00000 | 0.473160 | 18.9801 |