| Red | Green | Blue | |
| z | 17.64 | ||
| znorm | Inf | ||
| sky | -Inf | -Inf | -Inf |
| S/N | 19.7 | 32.0 | 32.1 |
| S/N(c) | 0.0 | 0.0 | 0.0 |
| SN(E/C) |
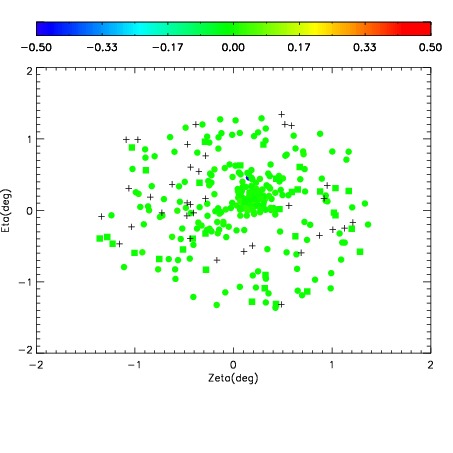
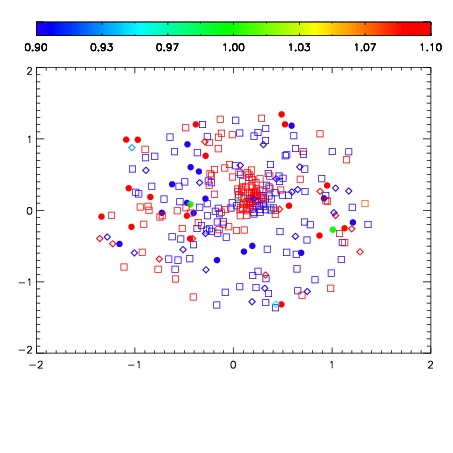
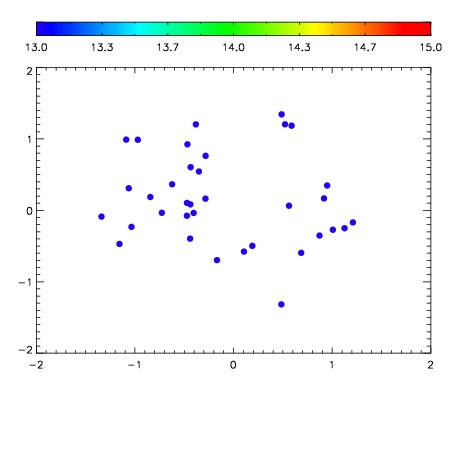

| Frame | Nreads | Zeropoints | Mag plots | Spatial mag deviation | Spatial sky 16325A emission deviations (filled: sky, open: star) | Spatial sky continuum emission | Spatial sky telluric CO2 absorption deviations (filled: H < 10) | |||||||||||||||||||||||
| 0 | 0 |
|
|
|
|
|
|
| IPAIR | NAME | SHIFT | NEWSHIFT | S/N | NAME | SHIFT | NEWSHIFT | S/N |
| 0 | 11410012 | 0.476782 | 0.00000 | 18.4653 | 11410011 | 0.00000 | 0.476782 | 18.3941 |
| 1 | 11410017 | 0.475244 | 0.00153801 | 18.8524 | 11410015 | -0.00194337 | 0.478725 | 18.7287 |
| 2 | 11410016 | 0.474839 | 0.00194299 | 18.7506 | 11410018 | -0.000883723 | 0.477666 | 18.6116 |
| 3 | 11410013 | 0.476743 | 3.89814e-05 | 18.6168 | 11410014 | -0.00204116 | 0.478823 | 18.5261 |