| Red | Green | Blue | |
| z | 17.64 | ||
| znorm | Inf | ||
| sky | -Inf | -Inf | -NaN |
| S/N | 26.9 | 48.8 | 52.7 |
| S/N(c) | 0.0 | 0.0 | 0.0 |
| SN(E/C) |
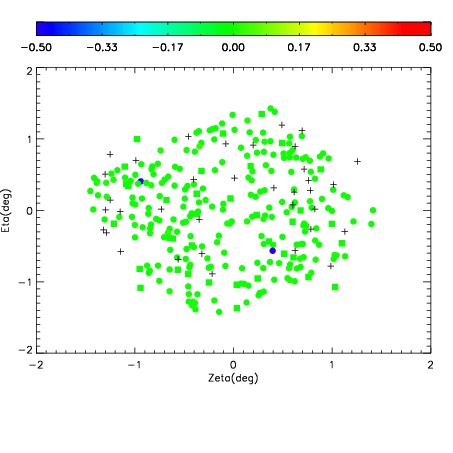
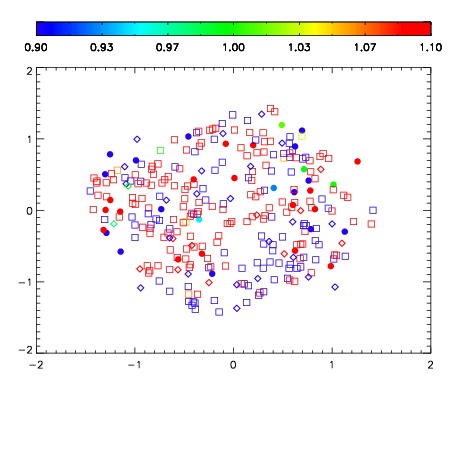
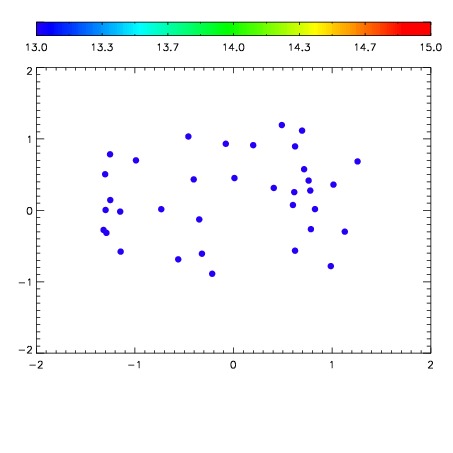

| Frame | Nreads | Zeropoints | Mag plots | Spatial mag deviation | Spatial sky 16325A emission deviations (filled: sky, open: star) | Spatial sky continuum emission | Spatial sky telluric CO2 absorption deviations (filled: H < 10) | |||||||||||||||||||||||
| 0 | 0 |
|
|
|
|
|
|
| IPAIR | NAME | SHIFT | NEWSHIFT | S/N | NAME | SHIFT | NEWSHIFT | S/N |
| 0 | 09950028 | 0.522761 | 0.00000 | 19.2154 | 09950026 | 0.00000 | 0.522761 | 19.2412 |
| 1 | 09950027 | 0.522096 | 0.000665009 | 19.2410 | 09950029 | -0.000613010 | 0.523374 | 19.2550 |
| 2 | 09950031 | 0.522331 | 0.000429988 | 19.2180 | 09950030 | -0.000660241 | 0.523421 | 19.2440 |
| 3 | 09950032 | 0.522357 | 0.000404000 | 19.2051 | 09950033 | -5.65848e-06 | 0.522767 | 19.2138 |