| Red | Green | Blue | |
| z | 17.64 | ||
| znorm | Inf | ||
| sky | -Inf | -NaN | -Inf |
| S/N | 22.8 | 41.1 | 46.0 |
| S/N(c) | 0.0 | 0.0 | 0.0 |
| SN(E/C) |
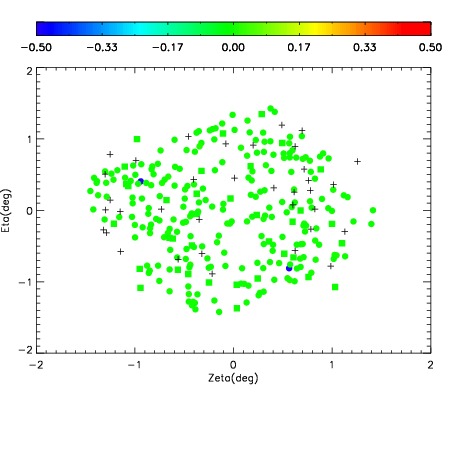
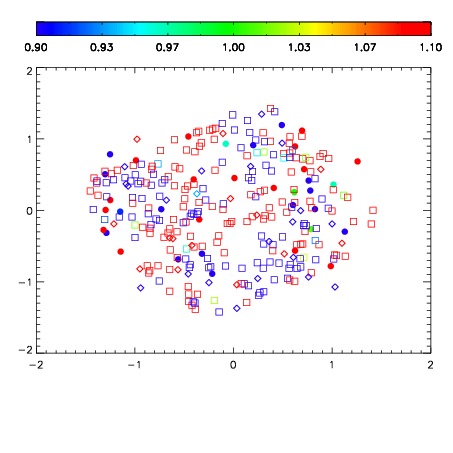
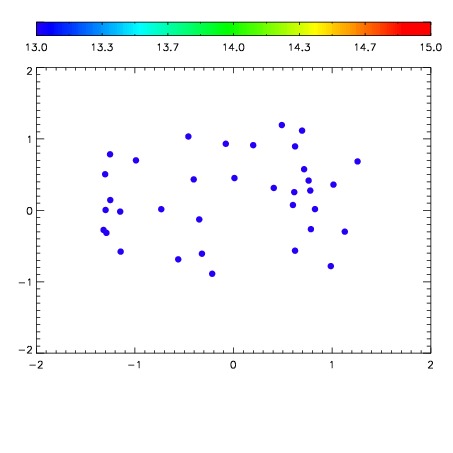

| Frame | Nreads | Zeropoints | Mag plots | Spatial mag deviation | Spatial sky 16325A emission deviations (filled: sky, open: star) | Spatial sky continuum emission | Spatial sky telluric CO2 absorption deviations (filled: H < 10) | |||||||||||||||||||||||
| 0 | 0 |
|
|
|
|
|
|
| IPAIR | NAME | SHIFT | NEWSHIFT | S/N | NAME | SHIFT | NEWSHIFT | S/N |
| 0 | 09970035 | 0.524508 | 0.00000 | 19.1538 | 09970037 | 0.00210731 | 0.522401 | 19.1841 |
| 1 | 09970039 | 0.523309 | 0.00119901 | 19.2114 | 09970040 | 0.00258801 | 0.521920 | 19.2116 |
| 2 | 09970038 | 0.523773 | 0.000734985 | 19.1999 | 09970036 | 0.00180048 | 0.522708 | 19.1844 |
| 3 | 09970034 | 0.523763 | 0.000744998 | 19.1078 | 09970033 | 0.00000 | 0.524508 | 19.1224 |