| Red | Green | Blue | |
| z | 17.64 | ||
| znorm | Inf | ||
| sky | -Inf | -Inf | -Inf |
| S/N | 23.1 | 41.6 | 46.6 |
| S/N(c) | 0.0 | 0.0 | 0.0 |
| SN(E/C) |
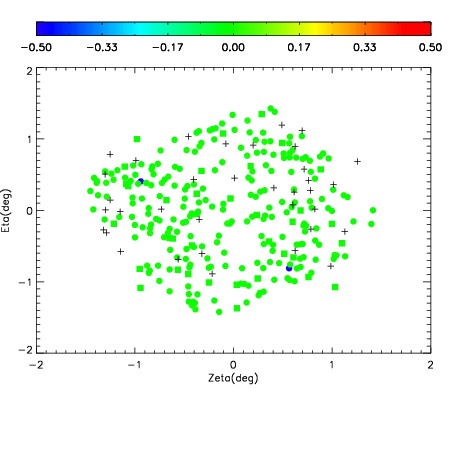
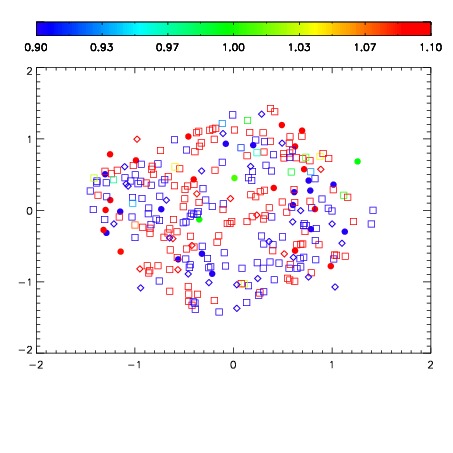
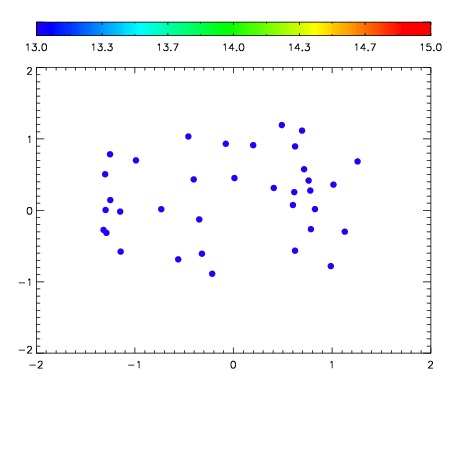

| Frame | Nreads | Zeropoints | Mag plots | Spatial mag deviation | Spatial sky 16325A emission deviations (filled: sky, open: star) | Spatial sky continuum emission | Spatial sky telluric CO2 absorption deviations (filled: H < 10) | |||||||||||||||||||||||
| 0 | 0 |
|
|
|
|
|
|
| IPAIR | NAME | SHIFT | NEWSHIFT | S/N | NAME | SHIFT | NEWSHIFT | S/N |
| 0 | 09980024 | 0.524681 | 0.00000 | 19.2170 | 09980026 | 0.000587352 | 0.524094 | 19.1828 |
| 1 | 09980023 | 0.524507 | 0.000173986 | 19.2294 | 09980022 | 0.00000 | 0.524681 | 19.1862 |
| 2 | 09980027 | 0.523508 | 0.00117296 | 19.1435 | 09980025 | 0.00109993 | 0.523581 | 19.1760 |
| 3 | 09980028 | 0.523264 | 0.00141698 | 19.1211 | 09980029 | 0.000925394 | 0.523756 | 19.1251 |