| Red | Green | Blue | |
| z | 17.64 | ||
| znorm | Inf | ||
| sky | -Inf | -NaN | -Inf |
| S/N | 27.7 | 46.5 | 50.2 |
| S/N(c) | 0.0 | 0.0 | 0.0 |
| SN(E/C) |
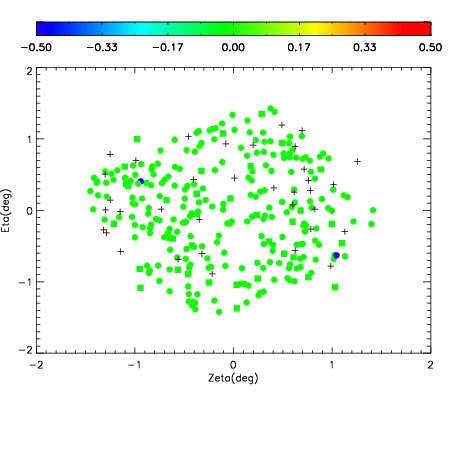
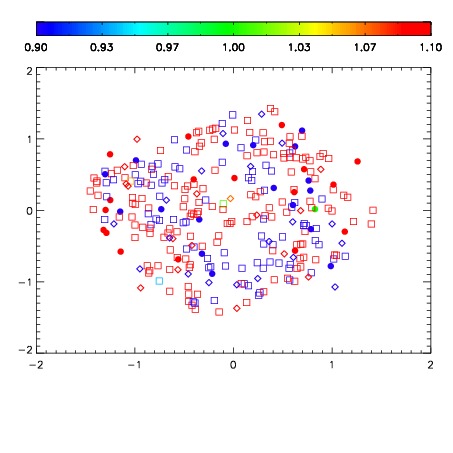
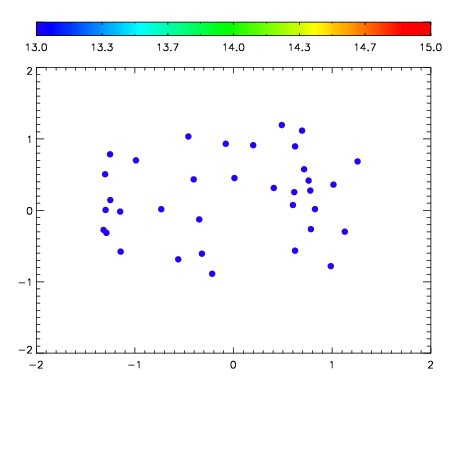

| Frame | Nreads | Zeropoints | Mag plots | Spatial mag deviation | Spatial sky 16325A emission deviations (filled: sky, open: star) | Spatial sky continuum emission | Spatial sky telluric CO2 absorption deviations (filled: H < 10) | |||||||||||||||||||||||
| 0 | 0 |
|
|
|
|
|
|
| IPAIR | NAME | SHIFT | NEWSHIFT | S/N | NAME | SHIFT | NEWSHIFT | S/N |
| 0 | 10230029 | 0.504822 | 0.00000 | 19.1831 | 10230034 | -0.000859427 | 0.505681 | 19.1869 |
| 1 | 10230028 | 0.504406 | 0.000416040 | 19.1685 | 10230027 | 0.00000 | 0.504822 | 19.1854 |
| 2 | 10230033 | 0.503520 | 0.00130200 | 19.1633 | 10230030 | -0.000251370 | 0.505073 | 19.1638 |
| 3 | 10230032 | 0.503140 | 0.00168204 | 19.1475 | 10230031 | -0.000395101 | 0.505217 | 19.1405 |