| Red | Green | Blue | |
| z | 17.64 | ||
| znorm | Inf | ||
| sky | -NaN | -NaN | -Inf |
| S/N | 26.2 | 44.3 | 49.4 |
| S/N(c) | 0.0 | 0.0 | 0.0 |
| SN(E/C) |
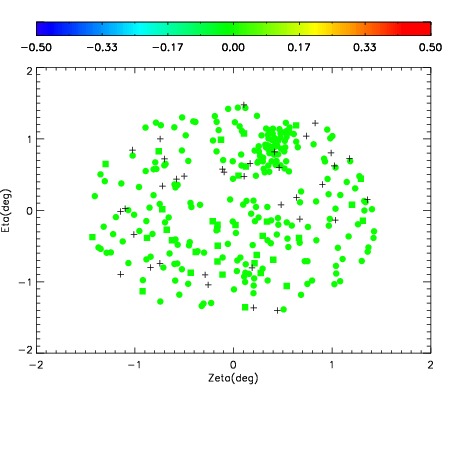
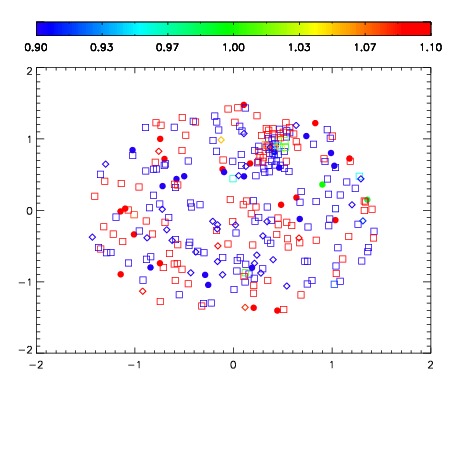
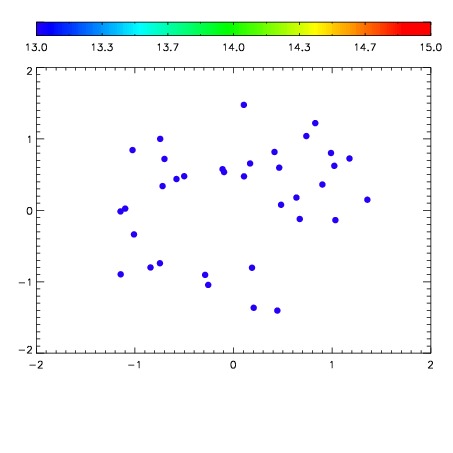

| Frame | Nreads | Zeropoints | Mag plots | Spatial mag deviation | Spatial sky 16325A emission deviations (filled: sky, open: star) | Spatial sky continuum emission | Spatial sky telluric CO2 absorption deviations (filled: H < 10) | |||||||||||||||||||||||
| 0 | 0 |
|
|
|
|
|
|
| IPAIR | NAME | SHIFT | NEWSHIFT | S/N | NAME | SHIFT | NEWSHIFT | S/N |
| 0 | 11040029 | 0.483638 | 0.00000 | 19.0675 | 11040027 | 0.00000 | 0.483638 | 19.0633 |
| 1 | 11040032 | 0.481510 | 0.00212798 | 19.1175 | 11040031 | -0.00109042 | 0.484728 | 19.1310 |
| 2 | 11040033 | 0.481311 | 0.00232700 | 19.0739 | 11040030 | -6.07751e-05 | 0.483699 | 19.1126 |
| 3 | 11040028 | 0.483091 | 0.000546992 | 19.0551 | 11040034 | -0.00153561 | 0.485174 | 19.0509 |