| Red | Green | Blue | |
| z | 17.64 | ||
| znorm | Inf | ||
| sky | -NaN | -Inf | -Inf |
| S/N | 22.6 | 37.6 | 42.4 |
| S/N(c) | 0.0 | 0.0 | 0.0 |
| SN(E/C) |
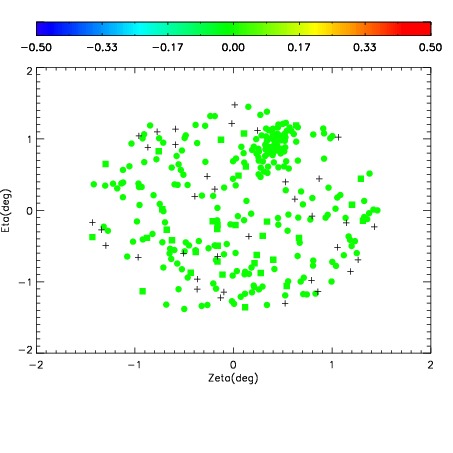
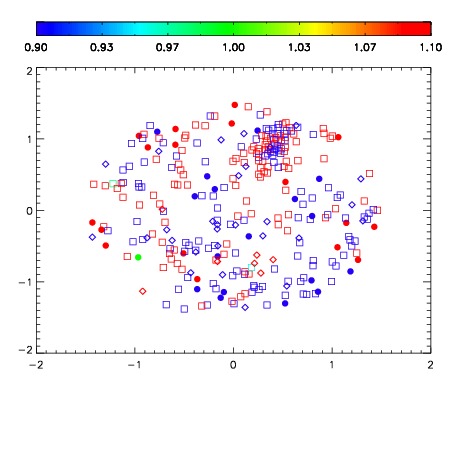
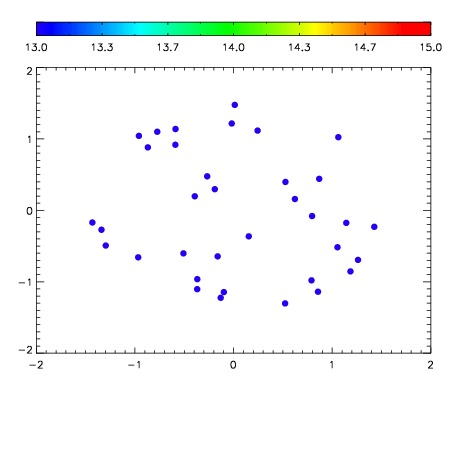

| Frame | Nreads | Zeropoints | Mag plots | Spatial mag deviation | Spatial sky 16325A emission deviations (filled: sky, open: star) | Spatial sky continuum emission | Spatial sky telluric CO2 absorption deviations (filled: H < 10) | |||||||||||||||||||||||
| 0 | 0 |
|
|
|
|
|
|
| IPAIR | NAME | SHIFT | NEWSHIFT | S/N | NAME | SHIFT | NEWSHIFT | S/N |
| 0 | 11350012 | 0.482902 | 0.00000 | 18.9279 | 11350013 | 0.000247437 | 0.482655 | 18.9388 |
| 1 | 11350015 | 0.480624 | 0.00227800 | 18.9687 | 11350017 | 0.00193367 | 0.480968 | 19.0191 |
| 2 | 11350016 | 0.481382 | 0.00151998 | 18.9678 | 11350014 | -4.46779e-05 | 0.482947 | 18.9907 |
| 3 | 11350011 | 0.482087 | 0.000815004 | 18.9190 | 11350010 | 0.00000 | 0.482902 | 18.7908 |