| Red | Green | Blue | |
| z | 17.64 | ||
| znorm | Inf | ||
| sky | -Inf | -Inf | -Inf |
| S/N | 25.7 | 44.7 | 47.5 |
| S/N(c) | 0.0 | 0.0 | 0.0 |
| SN(E/C) |


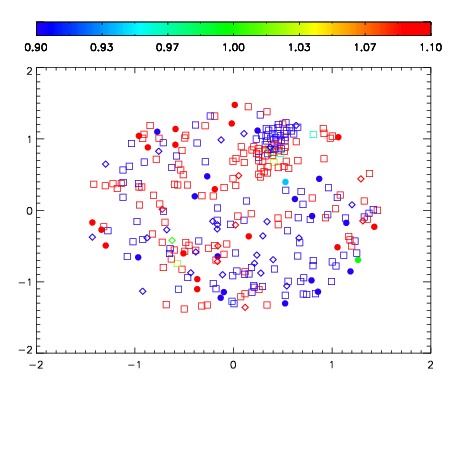


| Frame | Nreads | Zeropoints | Mag plots | Spatial mag deviation | Spatial sky 16325A emission deviations (filled: sky, open: star) | Spatial sky continuum emission | Spatial sky telluric CO2 absorption deviations (filled: H < 10) | |||||||||||||||||||||||
| 0 | 0 |
|
|
|
|
|
|
| IPAIR | NAME | SHIFT | NEWSHIFT | S/N | NAME | SHIFT | NEWSHIFT | S/N |
| 0 | 11400017 | 0.474753 | 0.00000 | 18.9799 | 11400018 | 0.000280811 | 0.474472 | 18.9515 |
| 1 | 11400016 | 0.474068 | 0.000685006 | 19.0066 | 11400011 | 0.00000 | 0.474753 | 19.0946 |
| 2 | 11400012 | 0.472935 | 0.00181800 | 19.0002 | 11400015 | -0.000394741 | 0.475148 | 18.9984 |
| 3 | 11400013 | 0.474464 | 0.000288993 | 18.8749 | 11400014 | -0.000372012 | 0.475125 | 18.9422 |