| Red | Green | Blue | |
| z | 17.64 | ||
| znorm | Inf | ||
| sky | -Inf | -Inf | -Inf |
| S/N | 25.4 | 44.3 | 47.8 |
| S/N(c) | 0.0 | 0.0 | 0.0 |
| SN(E/C) |


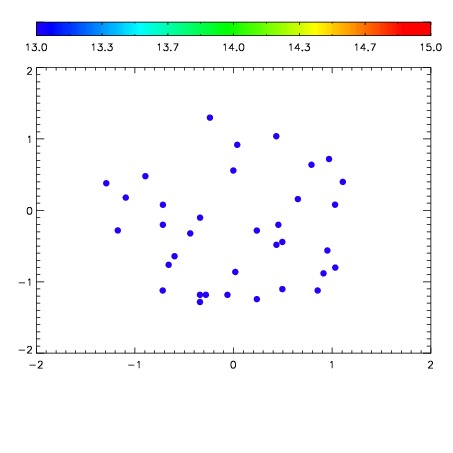

| Frame | Nreads | Zeropoints | Mag plots | Spatial mag deviation | Spatial sky 16325A emission deviations (filled: sky, open: star) | Spatial sky continuum emission | Spatial sky telluric CO2 absorption deviations (filled: H < 10) | |||||||||||||||||||||||
| 0 | 0 |
|
|
|
|
|
|
| IPAIR | NAME | SHIFT | NEWSHIFT | S/N | NAME | SHIFT | NEWSHIFT | S/N |
| 0 | 10800061 | 0.492439 | 0.00000 | 18.8757 | 10800062 | -0.00109038 | 0.493529 | 18.8384 |
| 1 | 10800068 | 0.489084 | 0.00335500 | 18.9817 | 10800067 | -0.000579249 | 0.493018 | 18.9824 |
| 2 | 10800065 | 0.490921 | 0.00151801 | 18.8822 | 10800066 | -0.000330418 | 0.492769 | 18.8743 |
| 3 | 10800064 | 0.490533 | 0.00190601 | 18.8632 | 10800063 | -0.000815328 | 0.493254 | 18.8307 |
| 4 | 10800060 | 0.491843 | 0.000596017 | 18.7839 | 10800059 | 0.00000 | 0.492439 | 18.7507 |