| Red | Green | Blue | |
| z | 17.64 | ||
| znorm | Inf | ||
| sky | -Inf | -Inf | -Inf |
| S/N | 24.9 | 42.9 | 47.2 |
| S/N(c) | 0.0 | 0.0 | 0.0 |
| SN(E/C) |

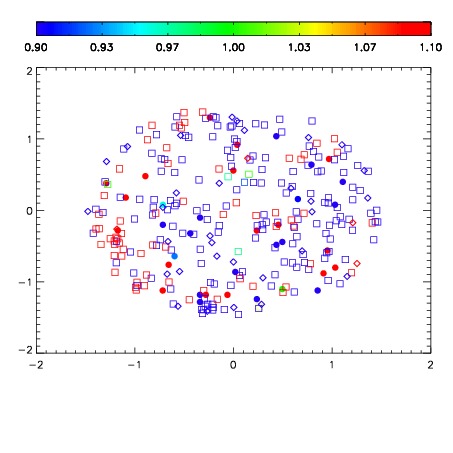
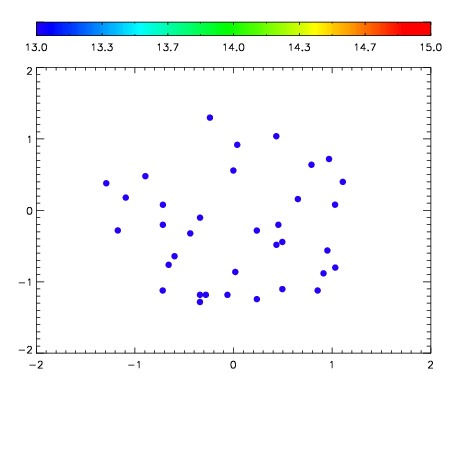

| Frame | Nreads | Zeropoints | Mag plots | Spatial mag deviation | Spatial sky 16325A emission deviations (filled: sky, open: star) | Spatial sky continuum emission | Spatial sky telluric CO2 absorption deviations (filled: H < 10) | |||||||||||||||||||||||
| 0 | 0 |
|
|
|
|
|
|
| IPAIR | NAME | SHIFT | NEWSHIFT | S/N | NAME | SHIFT | NEWSHIFT | S/N |
| 0 | 11040050 | 0.476744 | 0.00000 | 19.0003 | 11040052 | -0.00296204 | 0.479706 | 19.0090 |
| 1 | 11040051 | 0.476226 | 0.000517994 | 19.0339 | 11040049 | 0.00000 | 0.476744 | 19.0245 |
| 2 | 11040055 | 0.474480 | 0.00226399 | 18.9359 | 11040053 | -0.00334052 | 0.480085 | 18.9733 |
| 3 | 11040054 | 0.474431 | 0.00231299 | 18.9185 | 11040056 | -0.00323263 | 0.479977 | 18.9512 |