| Red | Green | Blue | |
| z | 17.64 | ||
| znorm | Inf | ||
| sky | -Inf | -NaN | -Inf |
| S/N | 29.0 | 49.2 | 51.0 |
| S/N(c) | 0.0 | 0.0 | 0.0 |
| SN(E/C) |
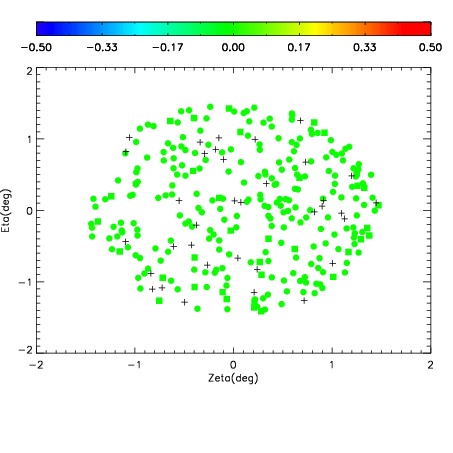
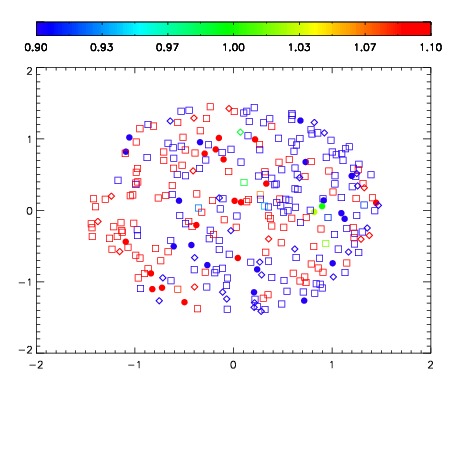
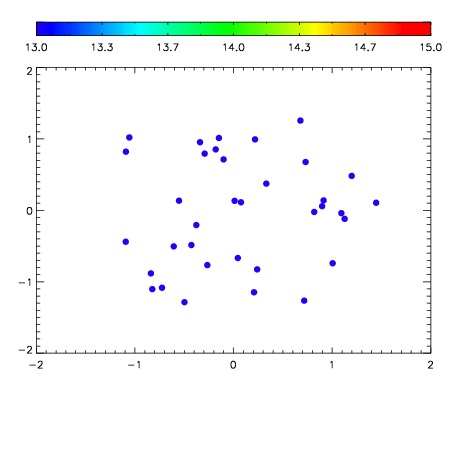

| Frame | Nreads | Zeropoints | Mag plots | Spatial mag deviation | Spatial sky 16325A emission deviations (filled: sky, open: star) | Spatial sky continuum emission | Spatial sky telluric CO2 absorption deviations (filled: H < 10) | |||||||||||||||||||||||
| 0 | 0 |
|
|
|
|
|
|
| IPAIR | NAME | SHIFT | NEWSHIFT | S/N | NAME | SHIFT | NEWSHIFT | S/N |
| 0 | 11070017 | 0.483012 | 0.00000 | 19.0766 | 11070018 | 0.000888197 | 0.482124 | 19.0456 |
| 1 | 11070013 | 0.482354 | 0.000658005 | 19.1307 | 11070015 | -0.00119016 | 0.484202 | 19.1250 |
| 2 | 11070012 | 0.481713 | 0.00129899 | 19.1110 | 11070014 | -0.00174669 | 0.484759 | 19.1142 |
| 3 | 11070016 | 0.481149 | 0.00186300 | 19.0537 | 11070011 | 0.00000 | 0.483012 | 19.0333 |