| Red | Green | Blue | |
| z | 17.64 | ||
| znorm | Inf | ||
| sky | -Inf | -Inf | -Inf |
| S/N | 24.7 | 42.9 | 45.0 |
| S/N(c) | 0.0 | 0.0 | 0.0 |
| SN(E/C) |
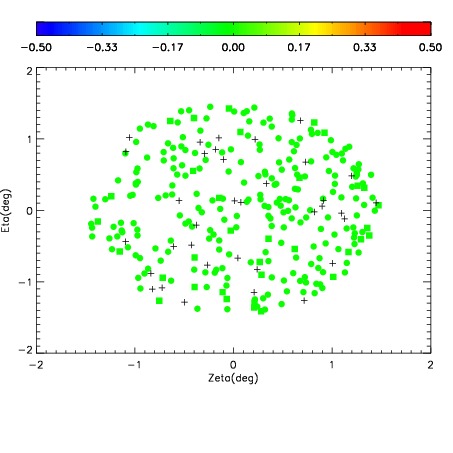
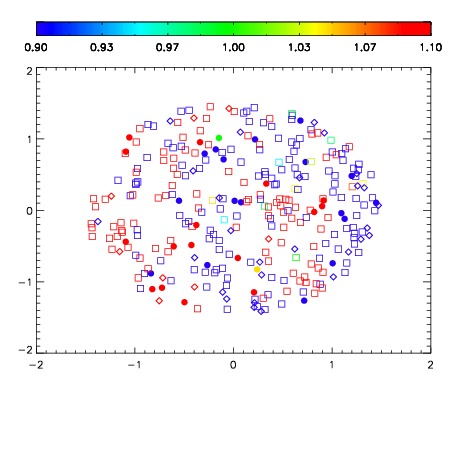
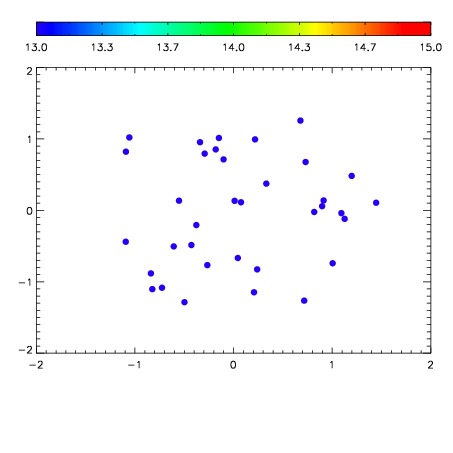

| Frame | Nreads | Zeropoints | Mag plots | Spatial mag deviation | Spatial sky 16325A emission deviations (filled: sky, open: star) | Spatial sky continuum emission | Spatial sky telluric CO2 absorption deviations (filled: H < 10) | |||||||||||||||||||||||
| 0 | 0 |
|
|
|
|
|
|
| IPAIR | NAME | SHIFT | NEWSHIFT | S/N | NAME | SHIFT | NEWSHIFT | S/N |
| 0 | 11110024 | 0.481418 | 0.00000 | 18.7458 | 11110026 | -0.00349233 | 0.484910 | 18.8622 |
| 1 | 11110028 | 0.475943 | 0.00547501 | 18.9232 | 11110029 | -0.00422127 | 0.485639 | 19.0210 |
| 2 | 11110027 | 0.476783 | 0.00463501 | 18.8923 | 11110025 | -0.00346207 | 0.484880 | 18.8989 |
| 3 | 11110023 | 0.480920 | 0.000498027 | 18.7925 | 11110022 | 0.00000 | 0.481418 | 18.8855 |