| Red | Green | Blue | |
| z | 17.64 | ||
| znorm | Inf | ||
| sky | -Inf | -NaN | -Inf |
| S/N | 24.5 | 41.6 | 43.5 |
| S/N(c) | 0.0 | 0.0 | 0.0 |
| SN(E/C) |
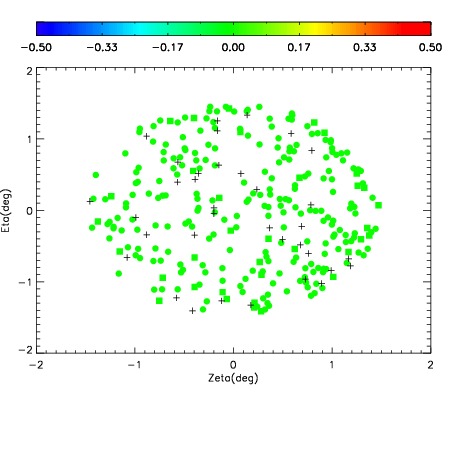


| Frame | Nreads | Zeropoints | Mag plots | Spatial mag deviation | Spatial sky 16325A emission deviations (filled: sky, open: star) | Spatial sky continuum emission | Spatial sky telluric CO2 absorption deviations (filled: H < 10) | |||||||||||||||||||||||
| 0 | 0 |
|
|
|
|
|
|
| IPAIR | NAME | SHIFT | NEWSHIFT | S/N | NAME | SHIFT | NEWSHIFT | S/N |
| 0 | 10820063 | 0.482443 | 0.00000 | 18.8847 | 10820061 | 0.00000 | 0.482443 | 18.8740 |
| 1 | 10820066 | 0.480683 | 0.00176001 | 19.0510 | 10820068 | -0.00197156 | 0.484415 | 19.0348 |
| 2 | 10820067 | 0.481417 | 0.00102600 | 18.9818 | 10820065 | -0.00242665 | 0.484870 | 18.9757 |
| 3 | 10820062 | 0.482435 | 8.01682e-06 | 18.7885 | 10820064 | -0.00159201 | 0.484035 | 18.7396 |