| Red | Green | Blue | |
| z | 17.64 | ||
| znorm | Inf | ||
| sky | -Inf | -Inf | -Inf |
| S/N | 22.8 | 40.1 | 41.8 |
| S/N(c) | 0.0 | 0.0 | 0.0 |
| SN(E/C) |

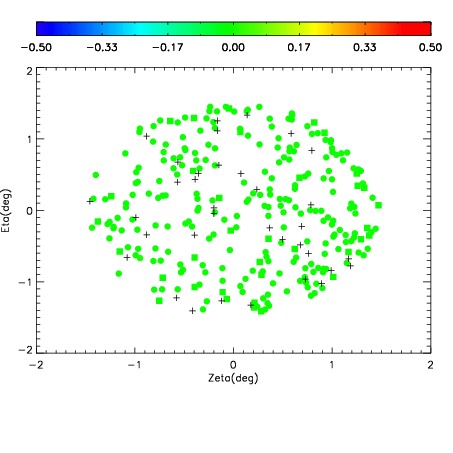
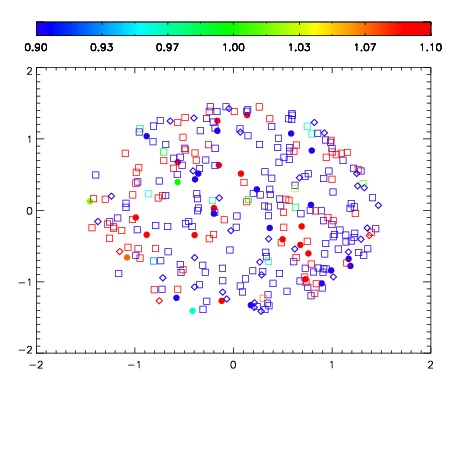
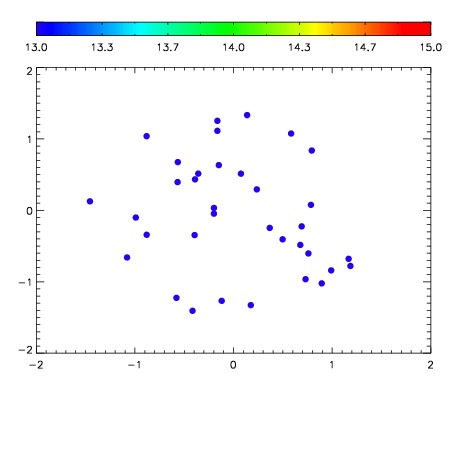

| Frame | Nreads | Zeropoints | Mag plots | Spatial mag deviation | Spatial sky 16325A emission deviations (filled: sky, open: star) | Spatial sky continuum emission | Spatial sky telluric CO2 absorption deviations (filled: H < 10) | |||||||||||||||||||||||
| 0 | 0 |
|
|
|
|
|
|
| IPAIR | NAME | SHIFT | NEWSHIFT | S/N | NAME | SHIFT | NEWSHIFT | S/N |
| 0 | 11150016 | 0.485757 | 0.00000 | 18.8367 | 11150018 | -0.000962440 | 0.486719 | 18.5794 |
| 1 | 11150012 | 0.484550 | 0.00120699 | 19.0560 | 11150011 | 0.00000 | 0.485757 | 19.0767 |
| 2 | 11150013 | 0.484521 | 0.00123599 | 19.0140 | 11150014 | -0.00140883 | 0.487166 | 18.8813 |
| 3 | 11150017 | 0.485675 | 8.19862e-05 | 18.8846 | 11150015 | -0.00130078 | 0.487058 | 18.7705 |