| Red | Green | Blue | |
| z | 17.64 | ||
| znorm | Inf | ||
| sky | -Inf | -Inf | -Inf |
| S/N | 28.5 | 49.9 | 52.9 |
| S/N(c) | 0.0 | 0.0 | 0.0 |
| SN(E/C) |
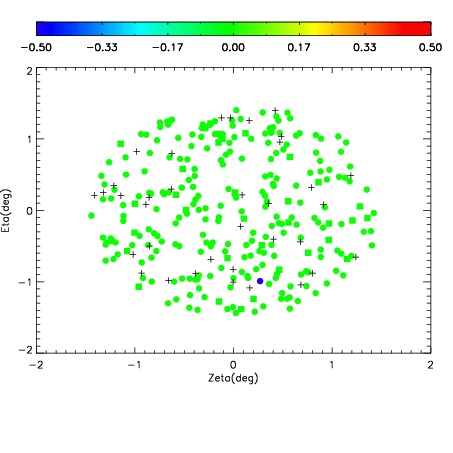
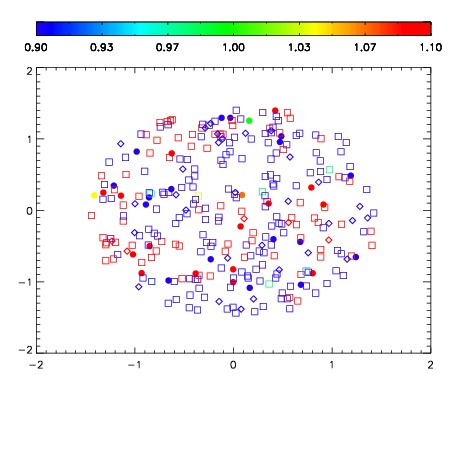
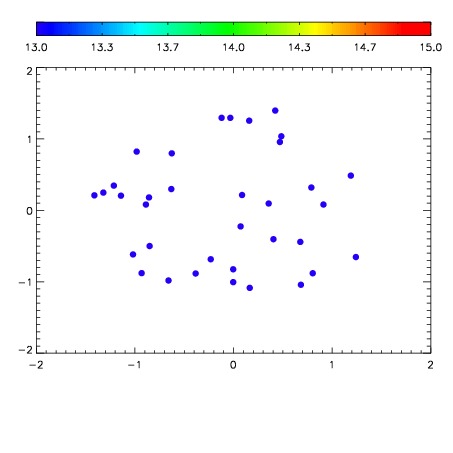

| Frame | Nreads | Zeropoints | Mag plots | Spatial mag deviation | Spatial sky 16325A emission deviations (filled: sky, open: star) | Spatial sky continuum emission | Spatial sky telluric CO2 absorption deviations (filled: H < 10) | |||||||||||||||||||||||
| 0 | 0 |
|
|
|
|
|
|
| IPAIR | NAME | SHIFT | NEWSHIFT | S/N | NAME | SHIFT | NEWSHIFT | S/N |
| 0 | 10240075 | 0.501136 | 0.00000 | 19.1848 | 10240074 | 0.00348511 | 0.497651 | 19.1726 |
| 1 | 10240076 | 0.501071 | 6.50287e-05 | 19.1880 | 10240077 | 0.00375106 | 0.497385 | 19.1968 |
| 2 | 10240072 | 0.497915 | 0.00322101 | 19.1182 | 10240073 | 0.00347724 | 0.497659 | 19.1158 |
| 3 | 10240071 | 0.497380 | 0.00375602 | 19.0772 | 10240070 | 0.00000 | 0.501136 | 19.0674 |