| Red | Green | Blue | |
| z | 17.64 | ||
| znorm | Inf | ||
| sky | -NaN | -Inf | -Inf |
| S/N | 26.4 | 44.9 | 47.4 |
| S/N(c) | 0.0 | 0.0 | 0.0 |
| SN(E/C) |
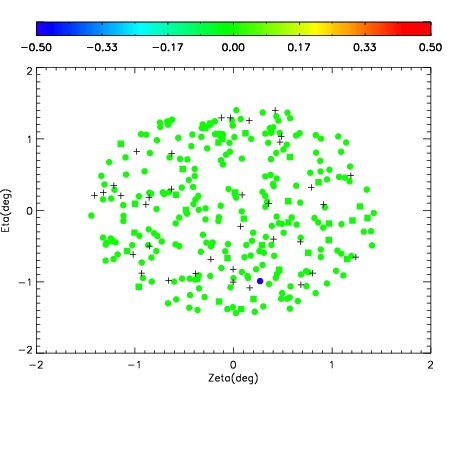
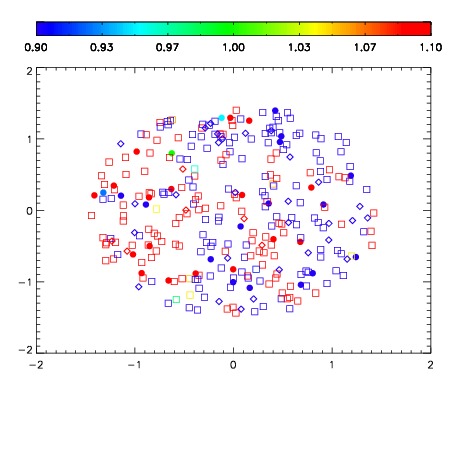
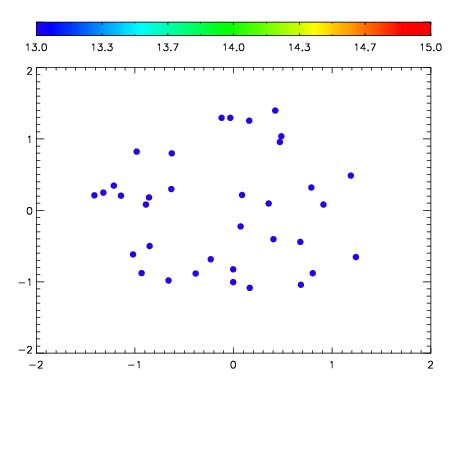

| Frame | Nreads | Zeropoints | Mag plots | Spatial mag deviation | Spatial sky 16325A emission deviations (filled: sky, open: star) | Spatial sky continuum emission | Spatial sky telluric CO2 absorption deviations (filled: H < 10) | |||||||||||||||||||||||
| 0 | 0 |
|
|
|
|
|
|
| IPAIR | NAME | SHIFT | NEWSHIFT | S/N | NAME | SHIFT | NEWSHIFT | S/N |
| 0 | 10530040 | 0.495605 | 0.00000 | 19.0348 | 10530034 | 0.00000 | 0.495605 | 19.0061 |
| 1 | 10530036 | 0.493648 | 0.00195700 | 19.1321 | 10530041 | -0.00808162 | 0.503687 | 19.1202 |
| 2 | 10530035 | 0.493652 | 0.00195301 | 19.0837 | 10530038 | -0.00645383 | 0.502059 | 19.0683 |
| 3 | 10530039 | 0.494868 | 0.000736982 | 19.0098 | 10530037 | -0.00671104 | 0.502316 | 19.0011 |