| Red | Green | Blue | |
| z | 17.64 | ||
| znorm | Inf | ||
| sky | -Inf | -Inf | -Inf |
| S/N | 25.0 | 43.3 | 48.4 |
| S/N(c) | 0.0 | 0.0 | 0.0 |
| SN(E/C) |


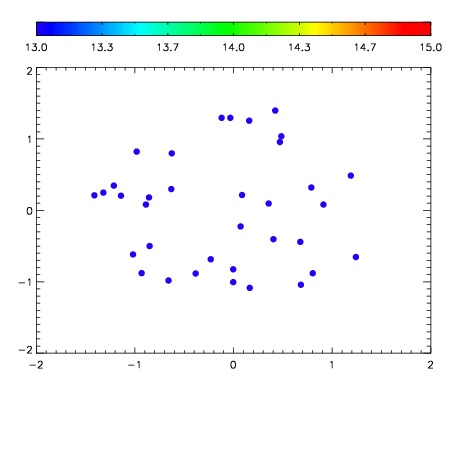

| Frame | Nreads | Zeropoints | Mag plots | Spatial mag deviation | Spatial sky 16325A emission deviations (filled: sky, open: star) | Spatial sky continuum emission | Spatial sky telluric CO2 absorption deviations (filled: H < 10) | |||||||||||||||||||||||
| 0 | 0 |
|
|
|
|
|
|
| IPAIR | NAME | SHIFT | NEWSHIFT | S/N | NAME | SHIFT | NEWSHIFT | S/N |
| 0 | 10800050 | 0.489938 | 0.00000 | 18.9134 | 10800052 | -0.00146994 | 0.491408 | 18.9909 |
| 1 | 10800054 | 0.488527 | 0.00141099 | 18.9934 | 10800055 | 0.000170738 | 0.489767 | 19.0358 |
| 2 | 10800053 | 0.487948 | 0.00198999 | 18.9267 | 10800051 | -0.00161291 | 0.491551 | 19.0316 |
| 3 | 10800049 | 0.489129 | 0.000808984 | 18.6081 | 10800048 | 0.00000 | 0.489938 | 18.8469 |