| Red | Green | Blue | |
| z | 17.64 | ||
| znorm | Inf | ||
| sky | -Inf | -Inf | -Inf |
| S/N | 32.0 | 55.3 | 58.3 |
| S/N(c) | 0.0 | 0.0 | 0.0 |
| SN(E/C) |

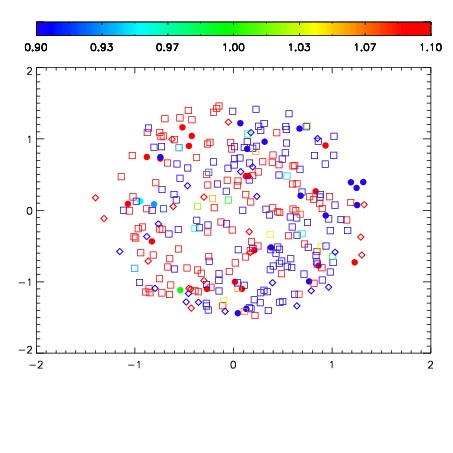


| Frame | Nreads | Zeropoints | Mag plots | Spatial mag deviation | Spatial sky 16325A emission deviations (filled: sky, open: star) | Spatial sky continuum emission | Spatial sky telluric CO2 absorption deviations (filled: H < 10) | |||||||||||||||||||||||
| 0 | 0 |
|
|
|
|
|
|
| IPAIR | NAME | SHIFT | NEWSHIFT | S/N | NAME | SHIFT | NEWSHIFT | S/N |
| 0 | 10260082 | 0.492899 | 0.00000 | 19.1635 | 10260088 | -0.000105470 | 0.493004 | 19.1805 |
| 1 | 10260089 | 0.492630 | 0.000268996 | 19.2102 | 10260083 | 0.00174474 | 0.491154 | 19.2130 |
| 2 | 10260085 | 0.492024 | 0.000874996 | 19.1898 | 10260084 | 0.00151136 | 0.491388 | 19.1827 |
| 3 | 10260081 | 0.492650 | 0.000248998 | 19.1218 | 10260080 | 0.00000 | 0.492899 | 19.0850 |
| 4 | 10260086 | 0.492414 | 0.000485003 | 18.9589 | 10260087 | -0.000268621 | 0.493168 | 19.0681 |