| Red | Green | Blue | |
| z | 17.64 | ||
| znorm | Inf | ||
| sky | -Inf | -Inf | -Inf |
| S/N | 24.8 | 44.0 | 46.1 |
| S/N(c) | 0.0 | 0.0 | 0.0 |
| SN(E/C) |
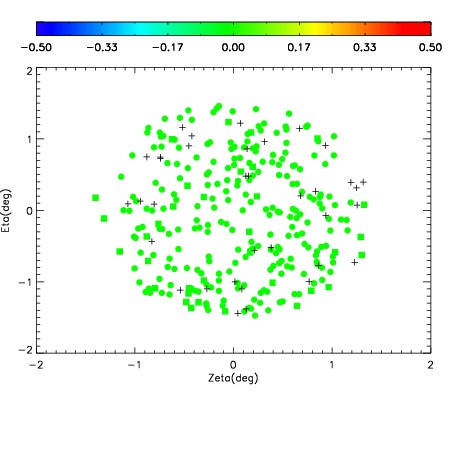
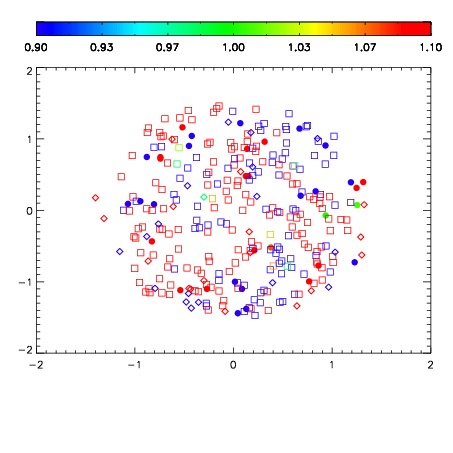
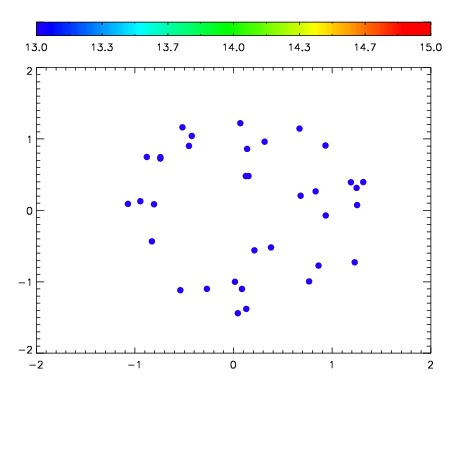

| Frame | Nreads | Zeropoints | Mag plots | Spatial mag deviation | Spatial sky 16325A emission deviations (filled: sky, open: star) | Spatial sky continuum emission | Spatial sky telluric CO2 absorption deviations (filled: H < 10) | |||||||||||||||||||||||
| 0 | 0 |
|
|
|
|
|
|
| IPAIR | NAME | SHIFT | NEWSHIFT | S/N | NAME | SHIFT | NEWSHIFT | S/N |
| 0 | 10750049 | 0.491004 | 0.00000 | 18.9972 | 10750048 | 0.00000 | 0.491004 | 18.8063 |
| 1 | 10750054 | 0.487142 | 0.00386199 | 19.0801 | 10750055 | -0.00328084 | 0.494285 | 19.0510 |
| 2 | 10750053 | 0.487370 | 0.00363398 | 19.0790 | 10750051 | -0.00112215 | 0.492126 | 19.0045 |
| 3 | 10750050 | 0.491003 | 9.83477e-07 | 19.0157 | 10750052 | -0.00136757 | 0.492372 | 18.9665 |