| Red | Green | Blue | |
| z | 17.64 | ||
| znorm | Inf | ||
| sky | -Inf | -NaN | -Inf |
| S/N | 18.8 | 35.5 | 36.5 |
| S/N(c) | 0.0 | 0.0 | 0.0 |
| SN(E/C) |
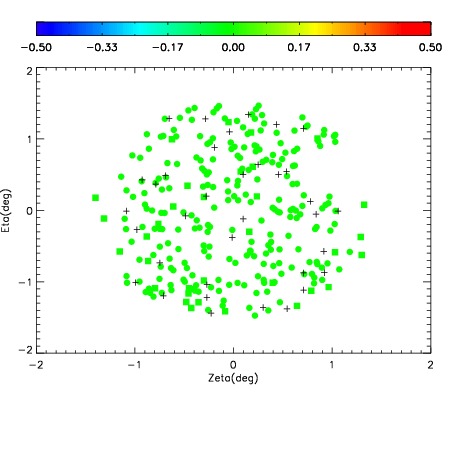
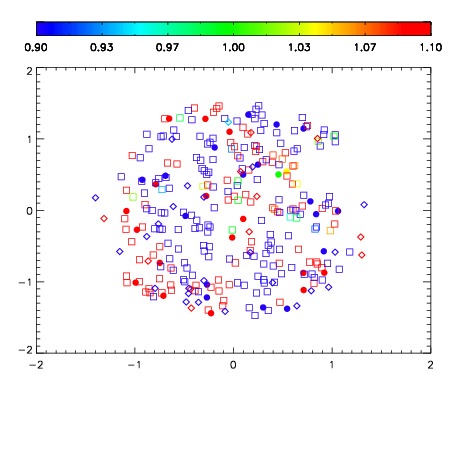
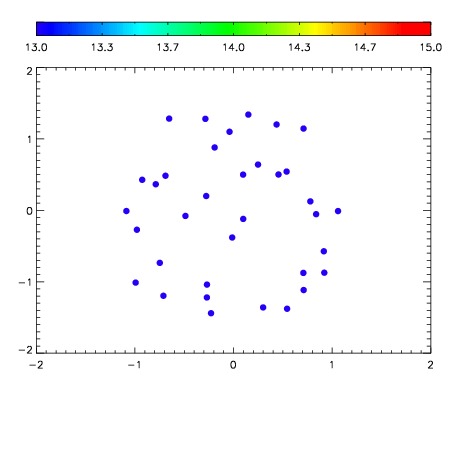

| Frame | Nreads | Zeropoints | Mag plots | Spatial mag deviation | Spatial sky 16325A emission deviations (filled: sky, open: star) | Spatial sky continuum emission | Spatial sky telluric CO2 absorption deviations (filled: H < 10) | |||||||||||||||||||||||
| 0 | 0 |
|
|
|
|
|
|
| IPAIR | NAME | SHIFT | NEWSHIFT | S/N | NAME | SHIFT | NEWSHIFT | S/N |
| 0 | 10610029 | 0.506043 | 0.00000 | 18.4138 | 10610031 | 0.00123784 | 0.504805 | 18.4890 |
| 1 | 10610034 | 0.505951 | 9.20296e-05 | 18.6224 | 10610032 | 0.00162041 | 0.504423 | 18.5910 |
| 2 | 10610033 | 0.504947 | 0.00109601 | 18.4967 | 10610035 | 0.00334318 | 0.502700 | 18.5257 |
| 3 | 10610030 | 0.505677 | 0.000366032 | 18.3031 | 10610028 | 0.00000 | 0.506043 | 18.2775 |