| Red | Green | Blue | |
| z | 17.64 | ||
| znorm | Inf | ||
| sky | -Inf | -Inf | -Inf |
| S/N | 19.4 | 35.1 | 35.8 |
| S/N(c) | 0.0 | 0.0 | 0.0 |
| SN(E/C) |
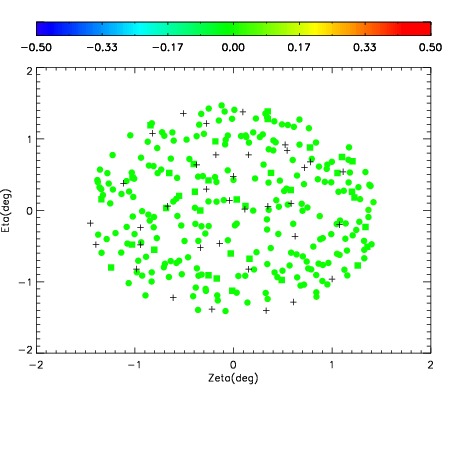
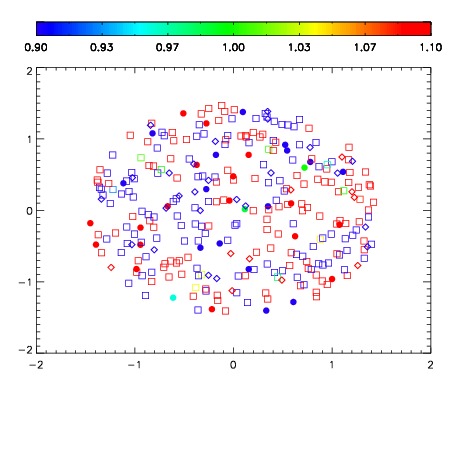
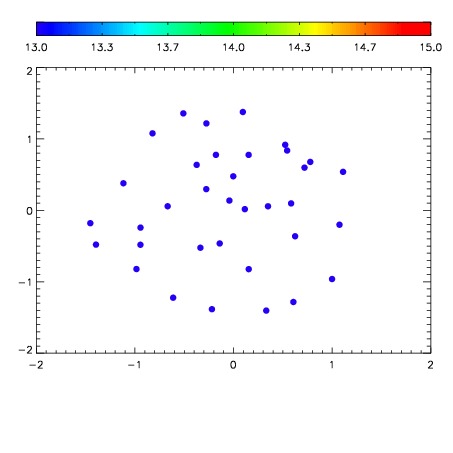

| Frame | Nreads | Zeropoints | Mag plots | Spatial mag deviation | Spatial sky 16325A emission deviations (filled: sky, open: star) | Spatial sky continuum emission | Spatial sky telluric CO2 absorption deviations (filled: H < 10) | |||||||||||||||||||||||
| 0 | 0 |
|
|
|
|
|
|
| IPAIR | NAME | SHIFT | NEWSHIFT | S/N | NAME | SHIFT | NEWSHIFT | S/N |
| 0 | 10460076 | 0.504410 | 0.00000 | 18.5197 | 10460074 | 0.00323561 | 0.501174 | 18.5385 |
| 1 | 10460071 | 0.503272 | 0.00113803 | 18.7627 | 10460073 | 0.00403094 | 0.500379 | 18.7695 |
| 2 | 10460072 | 0.503409 | 0.00100100 | 18.6464 | 10460070 | 0.00000 | 0.504410 | 18.7244 |
| 3 | 10460075 | 0.503827 | 0.000583053 | 18.6274 | 10460077 | 0.00331510 | 0.501095 | 18.5425 |