| Red | Green | Blue | |
| z | 17.64 | ||
| znorm | Inf | ||
| sky | -NaN | -Inf | -Inf |
| S/N | 26.9 | 46.9 | 48.9 |
| S/N(c) | 0.0 | 0.0 | 0.0 |
| SN(E/C) |
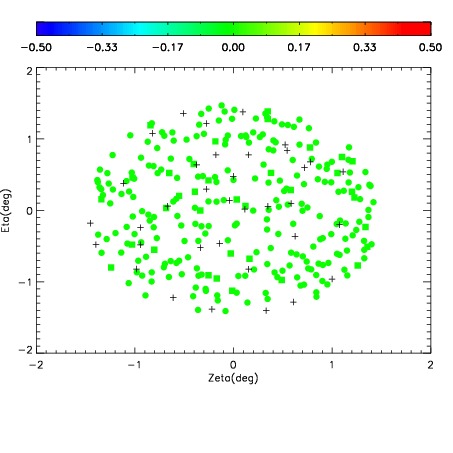
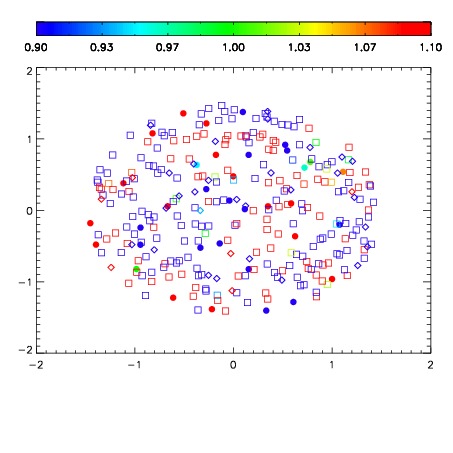
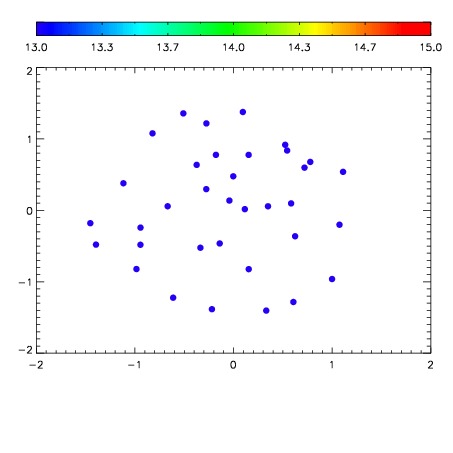

| Frame | Nreads | Zeropoints | Mag plots | Spatial mag deviation | Spatial sky 16325A emission deviations (filled: sky, open: star) | Spatial sky continuum emission | Spatial sky telluric CO2 absorption deviations (filled: H < 10) | |||||||||||||||||||||||
| 0 | 0 |
|
|
|
|
|
|
| IPAIR | NAME | SHIFT | NEWSHIFT | S/N | NAME | SHIFT | NEWSHIFT | S/N |
| 0 | 10750065 | 0.492528 | 0.00000 | 19.0801 | 10750067 | -0.00168450 | 0.494212 | 19.0965 |
| 1 | 10750064 | 0.491882 | 0.000645995 | 19.1197 | 10750063 | -0.000652905 | 0.493181 | 19.1526 |
| 2 | 10750068 | 0.491412 | 0.00111598 | 19.0936 | 10750062 | -0.000358385 | 0.492886 | 19.1443 |
| 3 | 10750060 | 0.490072 | 0.00245598 | 19.0900 | 10750066 | -0.00166224 | 0.494190 | 19.1113 |
| 4 | 10750061 | 0.490264 | 0.00226399 | 19.0535 | 10750059 | 0.00000 | 0.492528 | 19.0818 |