| Red | Green | Blue | |
| z | 17.64 | ||
| znorm | Inf | ||
| sky | -Inf | -NaN | -Inf |
| S/N | 23.6 | 42.7 | 43.8 |
| S/N(c) | 0.0 | 0.0 | 0.0 |
| SN(E/C) |
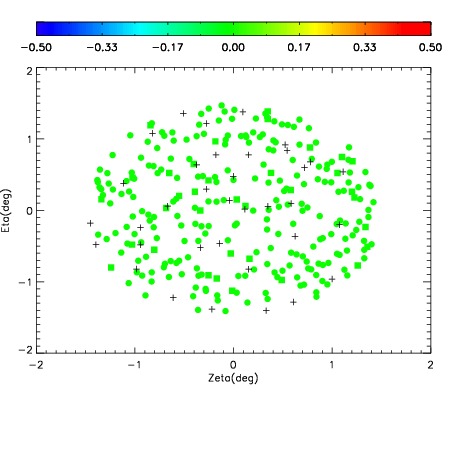
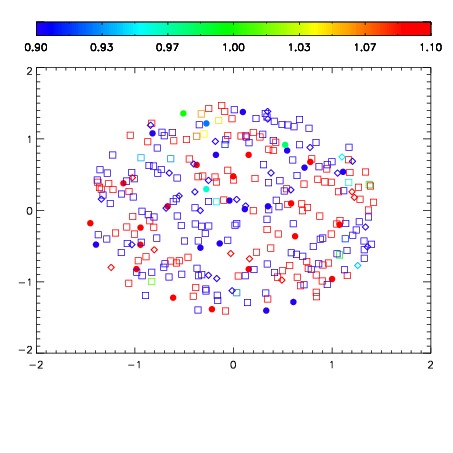


| Frame | Nreads | Zeropoints | Mag plots | Spatial mag deviation | Spatial sky 16325A emission deviations (filled: sky, open: star) | Spatial sky continuum emission | Spatial sky telluric CO2 absorption deviations (filled: H < 10) | |||||||||||||||||||||||
| 0 | 0 |
|
|
|
|
|
|
| IPAIR | NAME | SHIFT | NEWSHIFT | S/N | NAME | SHIFT | NEWSHIFT | S/N |
| 0 | 10840056 | 0.490055 | 0.00000 | 18.7707 | 10840050 | 0.00000 | 0.490055 | 18.8410 |
| 1 | 10840052 | 0.489061 | 0.000993997 | 18.8532 | 10840054 | -0.00163208 | 0.491687 | 18.9008 |
| 2 | 10840051 | 0.489435 | 0.000620008 | 18.7844 | 10840053 | -0.00180729 | 0.491862 | 18.8920 |
| 3 | 10840055 | 0.489185 | 0.000869989 | 18.6878 | 10840057 | 0.000100298 | 0.489955 | 18.7422 |
| 4 | 10840059 | 0.490003 | 5.20051e-05 | 18.1760 | 10840058 | 0.000298511 | 0.489756 | 18.3769 |