| Red | Green | Blue | |
| z | 17.64 | ||
| znorm | Inf | ||
| sky | -Inf | -Inf | -Inf |
| S/N | 18.6 | 34.8 | 35.7 |
| S/N(c) | 0.0 | 0.0 | 0.0 |
| SN(E/C) |
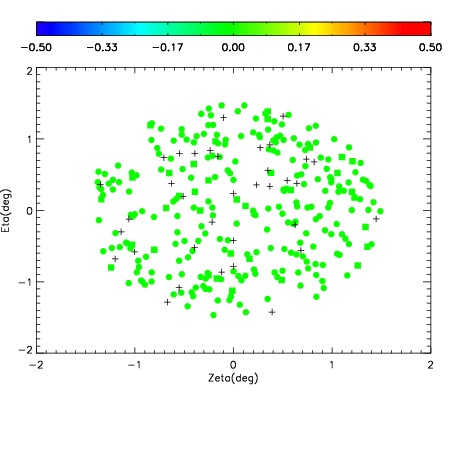

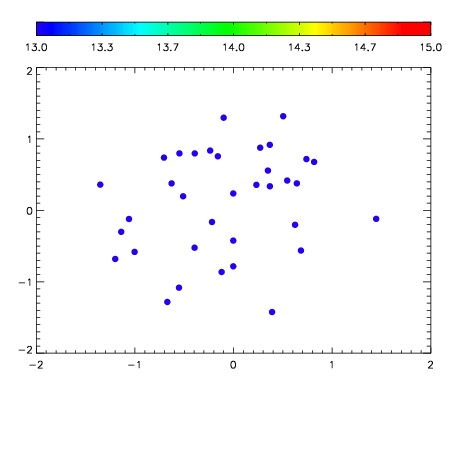

| Frame | Nreads | Zeropoints | Mag plots | Spatial mag deviation | Spatial sky 16325A emission deviations (filled: sky, open: star) | Spatial sky continuum emission | Spatial sky telluric CO2 absorption deviations (filled: H < 10) | |||||||||||||||||||||||
| 0 | 0 |
|
|
|
|
|
|
| IPAIR | NAME | SHIFT | NEWSHIFT | S/N | NAME | SHIFT | NEWSHIFT | S/N |
| 0 | 10790060 | 0.496909 | 0.00000 | 18.1460 | 10790061 | -0.000195252 | 0.497104 | 18.2044 |
| 1 | 10790064 | 0.495563 | 0.00134599 | 18.7677 | 10790065 | -0.00253724 | 0.499446 | 18.8583 |
| 2 | 10790063 | 0.495188 | 0.00172099 | 18.4439 | 10790058 | 0.00000 | 0.496909 | 18.4326 |
| 3 | 10790059 | 0.496566 | 0.000342995 | 18.1513 | 10790062 | -0.000914406 | 0.497823 | 18.4074 |