| Red | Green | Blue | |
| z | 17.64 | ||
| znorm | Inf | ||
| sky | -Inf | -Inf | -Inf |
| S/N | 30.1 | 49.9 | 54.3 |
| S/N(c) | 0.0 | 0.0 | 0.0 |
| SN(E/C) |
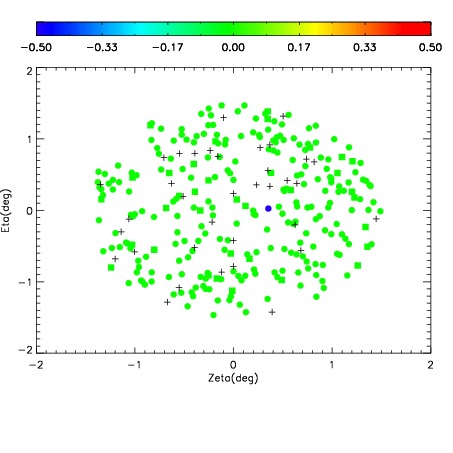
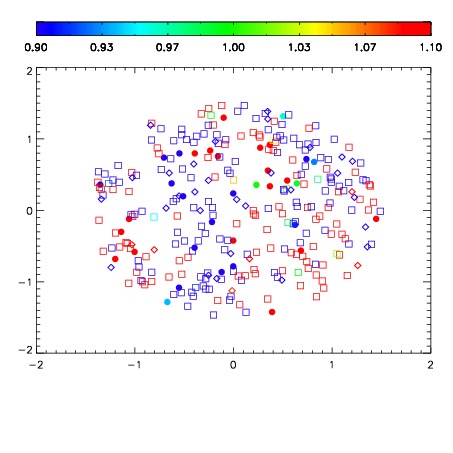
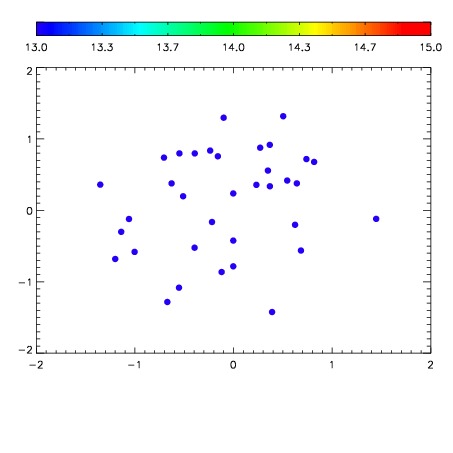

| Frame | Nreads | Zeropoints | Mag plots | Spatial mag deviation | Spatial sky 16325A emission deviations (filled: sky, open: star) | Spatial sky continuum emission | Spatial sky telluric CO2 absorption deviations (filled: H < 10) | |||||||||||||||||||||||
| 0 | 0 |
|
|
|
|
|
|
| IPAIR | NAME | SHIFT | NEWSHIFT | S/N | NAME | SHIFT | NEWSHIFT | S/N |
| 0 | 10880060 | 0.503104 | 0.00000 | 19.1715 | 10880058 | 0.00000 | 0.503104 | 19.1747 |
| 1 | 10880059 | 0.501707 | 0.00139695 | 19.1709 | 10880062 | -0.00123239 | 0.504336 | 19.1743 |
| 2 | 10880064 | 0.501556 | 0.00154799 | 19.1053 | 10880061 | -0.00102643 | 0.504130 | 19.1600 |
| 3 | 10880063 | 0.500480 | 0.00262398 | 19.0469 | 10880065 | -0.000902457 | 0.504006 | 19.0871 |