| Red | Green | Blue | |
| z | 17.64 | ||
| znorm | Inf | ||
| sky | -Inf | -Inf | -Inf |
| S/N | 20.9 | 39.4 | 40.2 |
| S/N(c) | 0.0 | 0.0 | 0.0 |
| SN(E/C) |
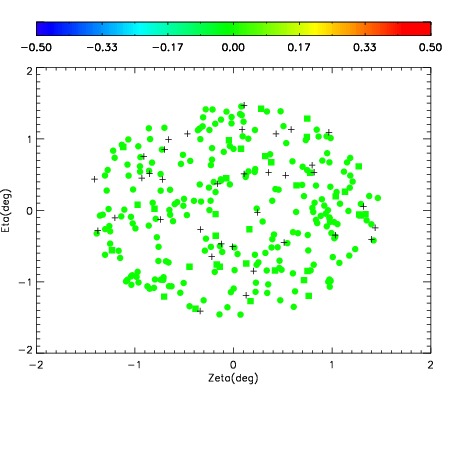
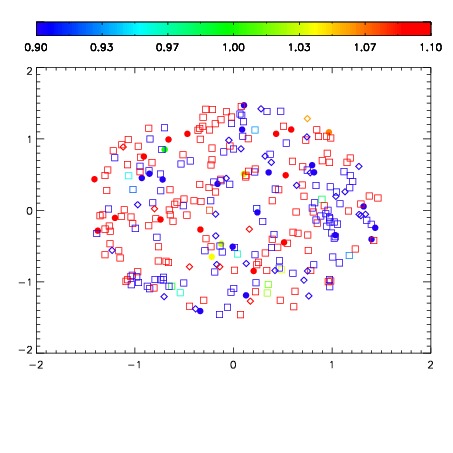
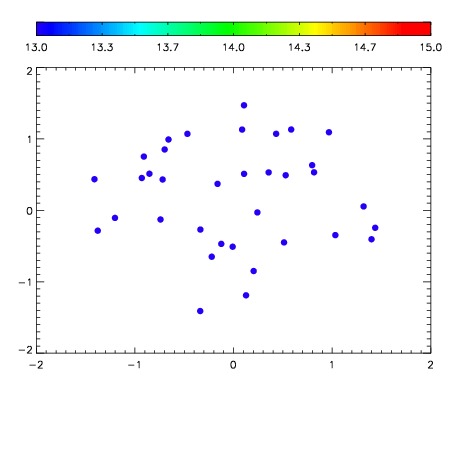

| Frame | Nreads | Zeropoints | Mag plots | Spatial mag deviation | Spatial sky 16325A emission deviations (filled: sky, open: star) | Spatial sky continuum emission | Spatial sky telluric CO2 absorption deviations (filled: H < 10) | |||||||||||||||||||||||
| 0 | 0 |
|
|
|
|
|
|
| IPAIR | NAME | SHIFT | NEWSHIFT | S/N | NAME | SHIFT | NEWSHIFT | S/N |
| 0 | 11060058 | 0.482173 | 0.00000 | 18.8498 | 11060052 | 0.00000 | 0.482173 | 18.8005 |
| 1 | 11060054 | 0.480419 | 0.00175399 | 18.8912 | 11060055 | -0.00113969 | 0.483313 | 18.9371 |
| 2 | 11060053 | 0.480515 | 0.00165799 | 18.8670 | 11060059 | -0.00284968 | 0.485023 | 18.8433 |
| 3 | 11060057 | 0.481365 | 0.000808001 | 18.7501 | 11060056 | -0.000724026 | 0.482897 | 18.7782 |