| Red | Green | Blue | |
| z | 17.64 | ||
| znorm | Inf | ||
| sky | -Inf | -Inf | -NaN |
| S/N | 23.4 | 41.5 | 43.3 |
| S/N(c) | 0.0 | 0.0 | 0.0 |
| SN(E/C) |
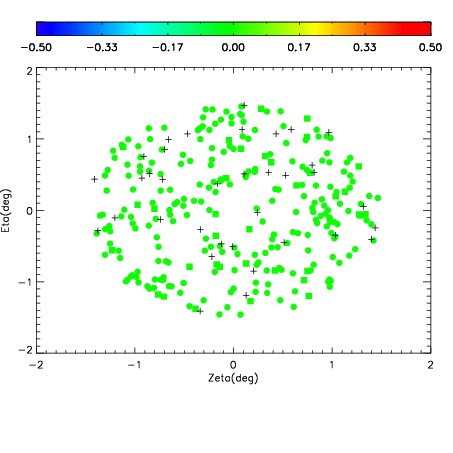
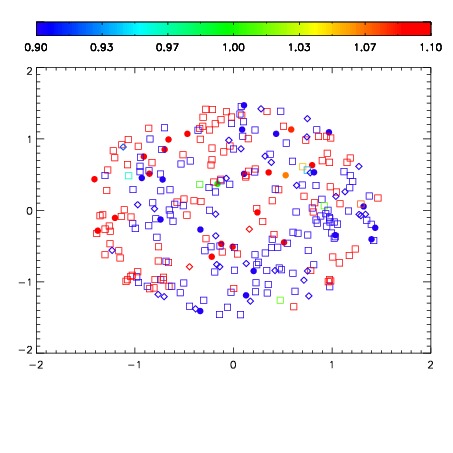
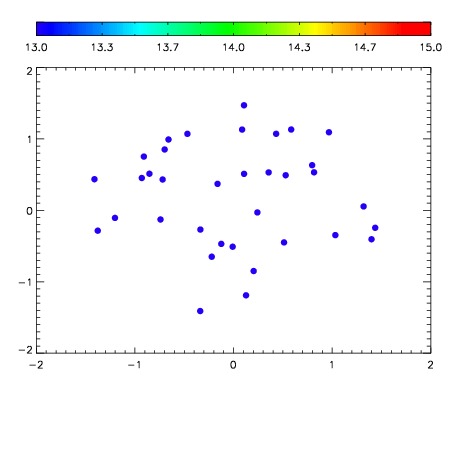

| Frame | Nreads | Zeropoints | Mag plots | Spatial mag deviation | Spatial sky 16325A emission deviations (filled: sky, open: star) | Spatial sky continuum emission | Spatial sky telluric CO2 absorption deviations (filled: H < 10) | |||||||||||||||||||||||
| 0 | 0 |
|
|
|
|
|
|
| IPAIR | NAME | SHIFT | NEWSHIFT | S/N | NAME | SHIFT | NEWSHIFT | S/N |
| 0 | 11340028 | 0.481410 | 0.00000 | 18.9812 | 11340026 | -0.00123789 | 0.482648 | 18.9802 |
| 1 | 11340029 | 0.481144 | 0.000265986 | 18.9877 | 11340030 | -0.00330227 | 0.484712 | 19.0141 |
| 2 | 11340025 | 0.480365 | 0.00104499 | 18.9595 | 11340027 | -0.00189809 | 0.483308 | 18.9648 |
| 3 | 11340024 | 0.480691 | 0.000719011 | 18.9330 | 11340023 | 0.00000 | 0.481410 | 18.8763 |